How to Make a Map with Multiple Locations
Put dozens or thousands of locations on one map: drop pins, import a spreadsheet, or add ready-made places. Style, cluster, label and share it free.
Updated · by the mapbow team
Whether it is five holiday stops or five thousand customers, putting multiple locations on one map is the most common mapping job there is. The challenge isn't adding the points – it is making a map that is still readable once they are all there. This guide covers the three ways to add many locations in mapbow – importing a spreadsheet, dropping pins by hand and adding ready-made places – and the styling choices that keep a busy map clear.
Method 1: Import a spreadsheet (hundreds to thousands)
If your locations already live in Excel, Google Sheets or a CRM, import them in one go. Imports are free, unlimited and never use one of your data-layer slots. (For every format and option, see the Excel and CSV import guide.)
Prepare the spreadsheet
- One row per location, with a header row.
- A
latitudeand alongitudecolumn in decimal degrees (e.g.40.7484,-73.9857). Common names such as lat, lng, x and y are detected automatically. - No coordinates? An
addresscolumn works too – mapbow looks the addresses up for you. - A
namecolumn for labels, and any other columns you want in popups – address, phone, category, sales, notes.
| name | latitude | longitude | category | phone |
|---|---|---|---|---|
| Harbour Store | -33.8610 | 151.2108 | Flagship | 02 9000 0000 |
| Parramatta Store | -33.8150 | 151.0011 | Standard | 02 9000 0001 |
Not sure of the layout? The Import panel has a Download a sample CSV link you can fill in.
Import it, step by step
- Open Import. Click Import on the left. Drop a CSV or Excel file on the box (or anywhere on the map), or click it to choose one. GeoJSON, KML, KMZ, GPX and zipped Shapefiles work the same way.
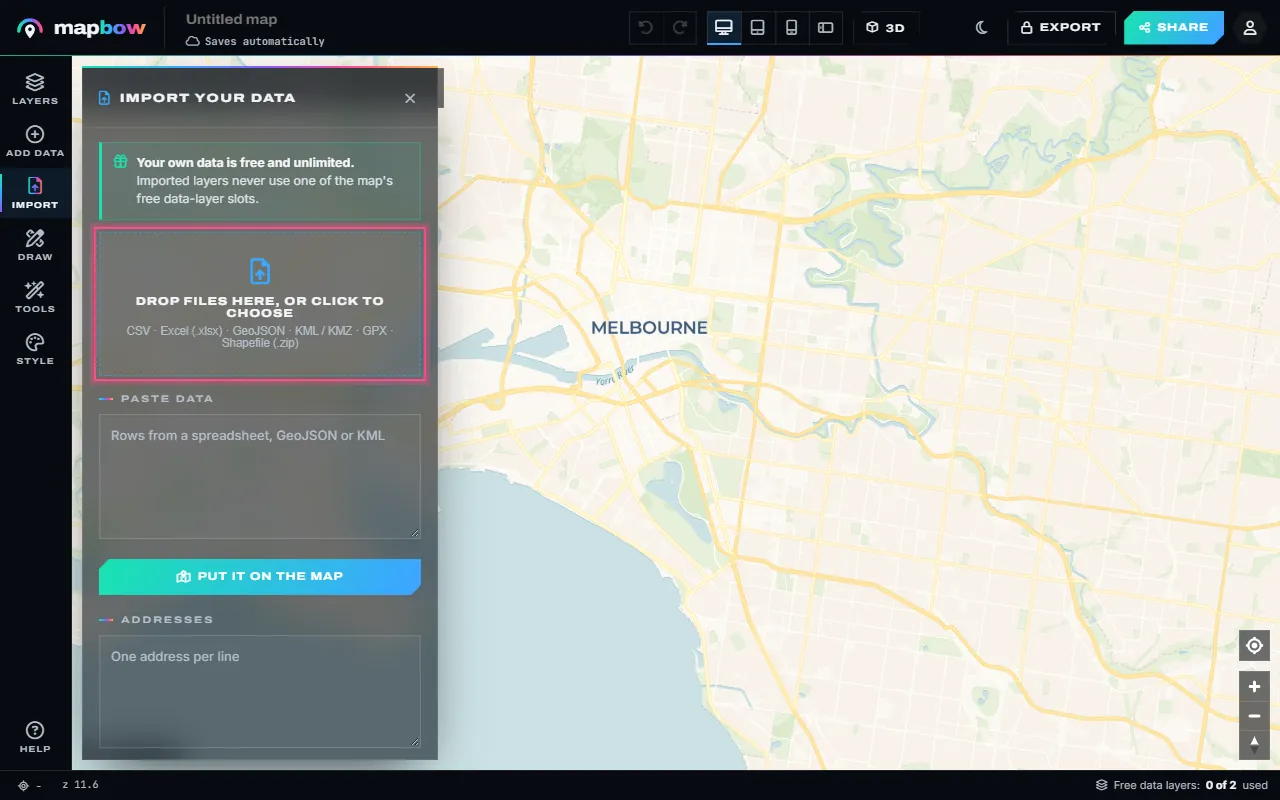
Step 1 The Import panel takes files, pasted rows and plain addresses. - Or paste your rows. Copy the rows straight from Excel or Google Sheets - header row included - and paste them into Paste data. You can also press Ctrl+V with the map in front of you.
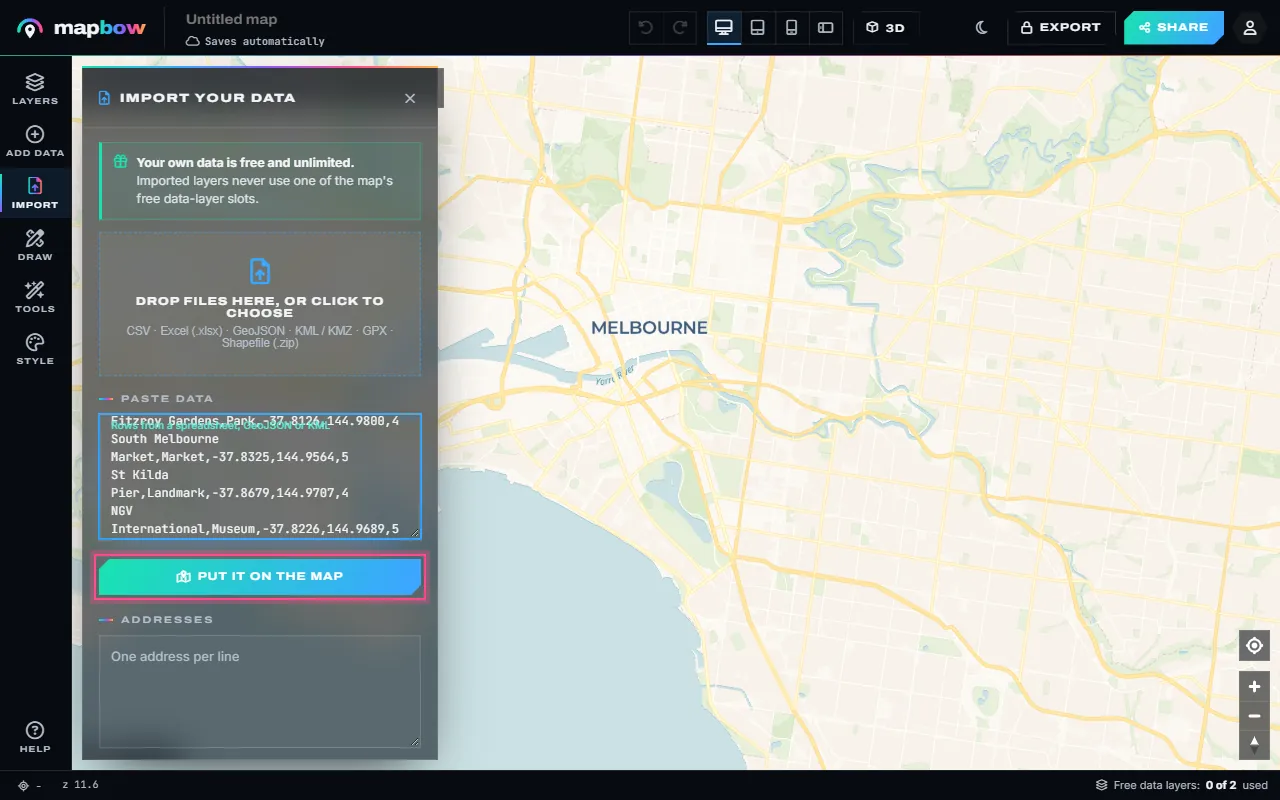
Step 2 Ten places pasted from a spreadsheet, with a header row. - Check the columns. mapbow finds the latitude and longitude columns by their names and shows the first rows. Pick the column that holds each place's name and name the layer. No coordinates? Switch to Addresses.
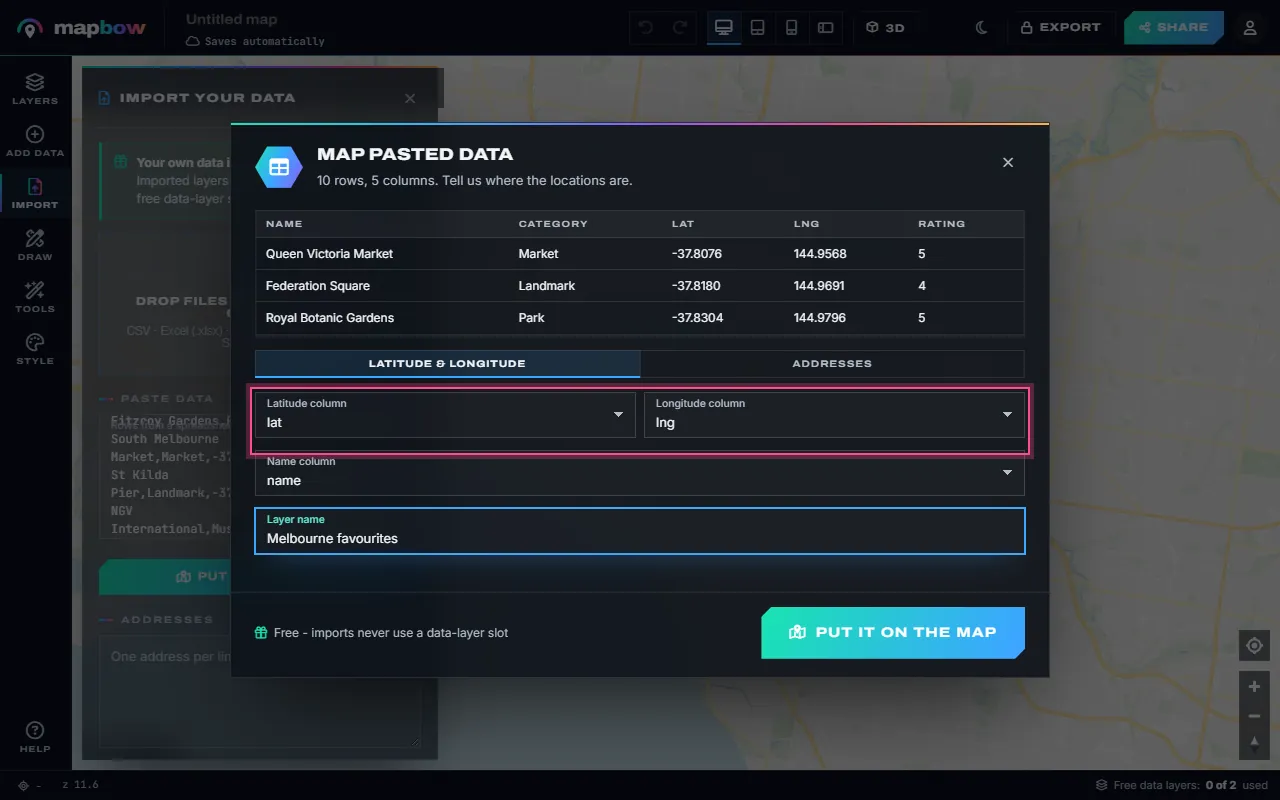
Step 3 Latitude, longitude and name columns are picked for you. - Every place, pinned. All the rows become pins, labelled with their names. The new layer is free and unlimited - imports never use a data-layer slot. Rows without a valid location are skipped, and a message tells you how many.
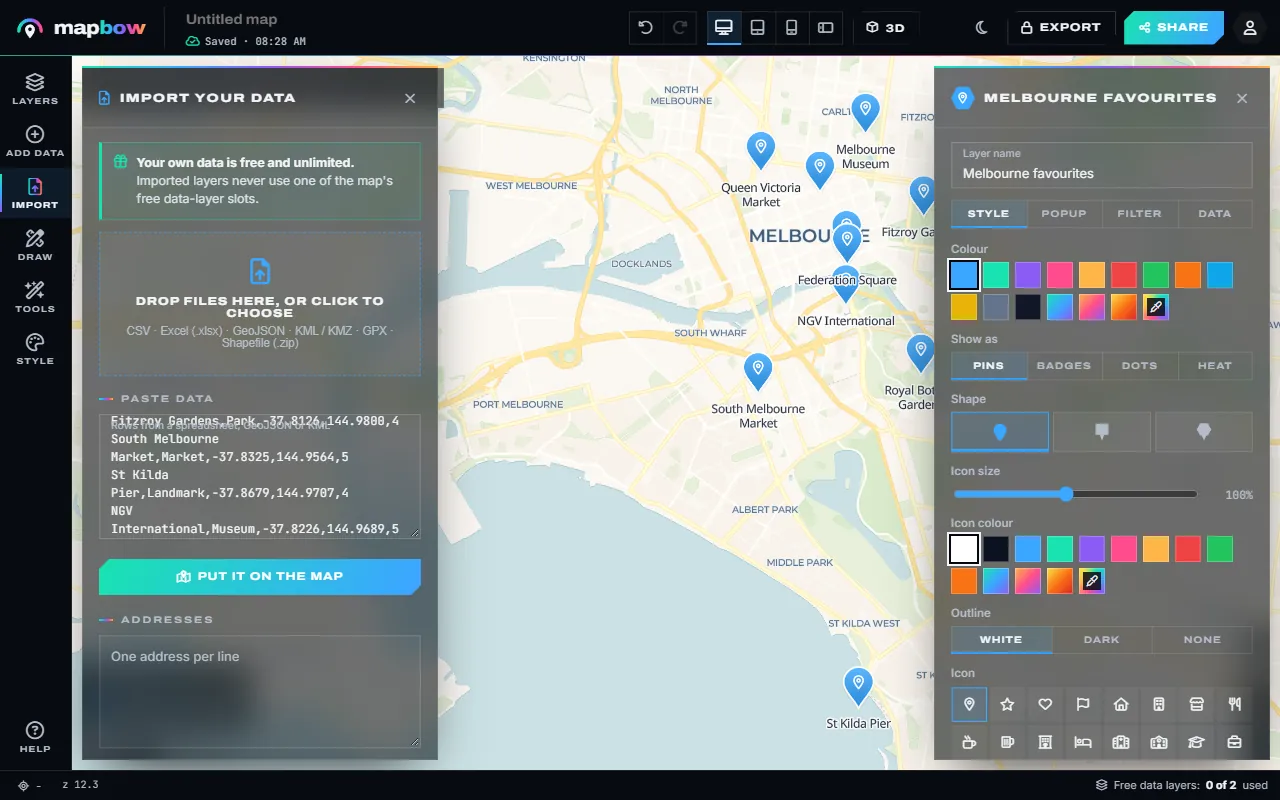
Step 4 Ten Melbourne places on the map, labelled. - Colour them by a column. In the inspector, Colour by field gives every category its own colour and adds it to the legend.
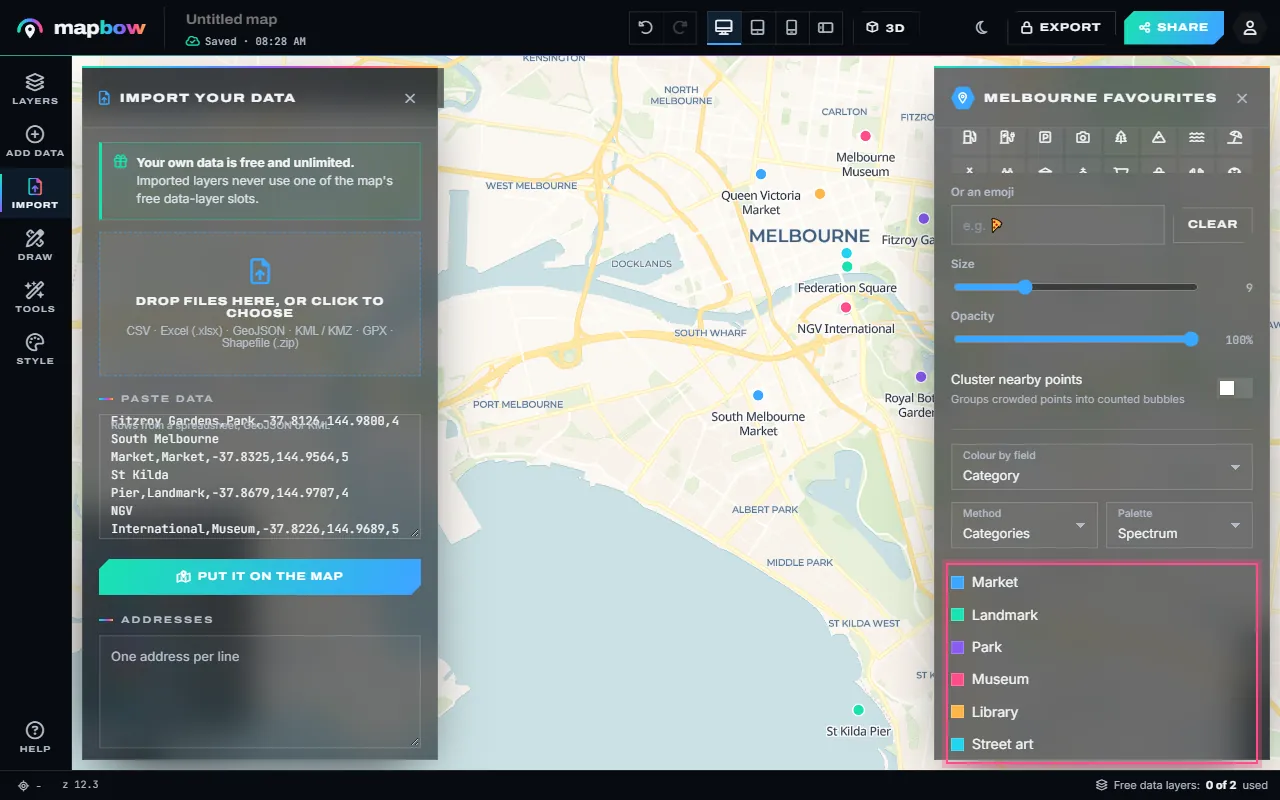
Step 5 Coloured by category, with a legend. - Edit the data in a table. Open Data › Open the table to see every row: search, sort, fix a typo in any cell, add a column or delete a row. Click a row number to fly to it.
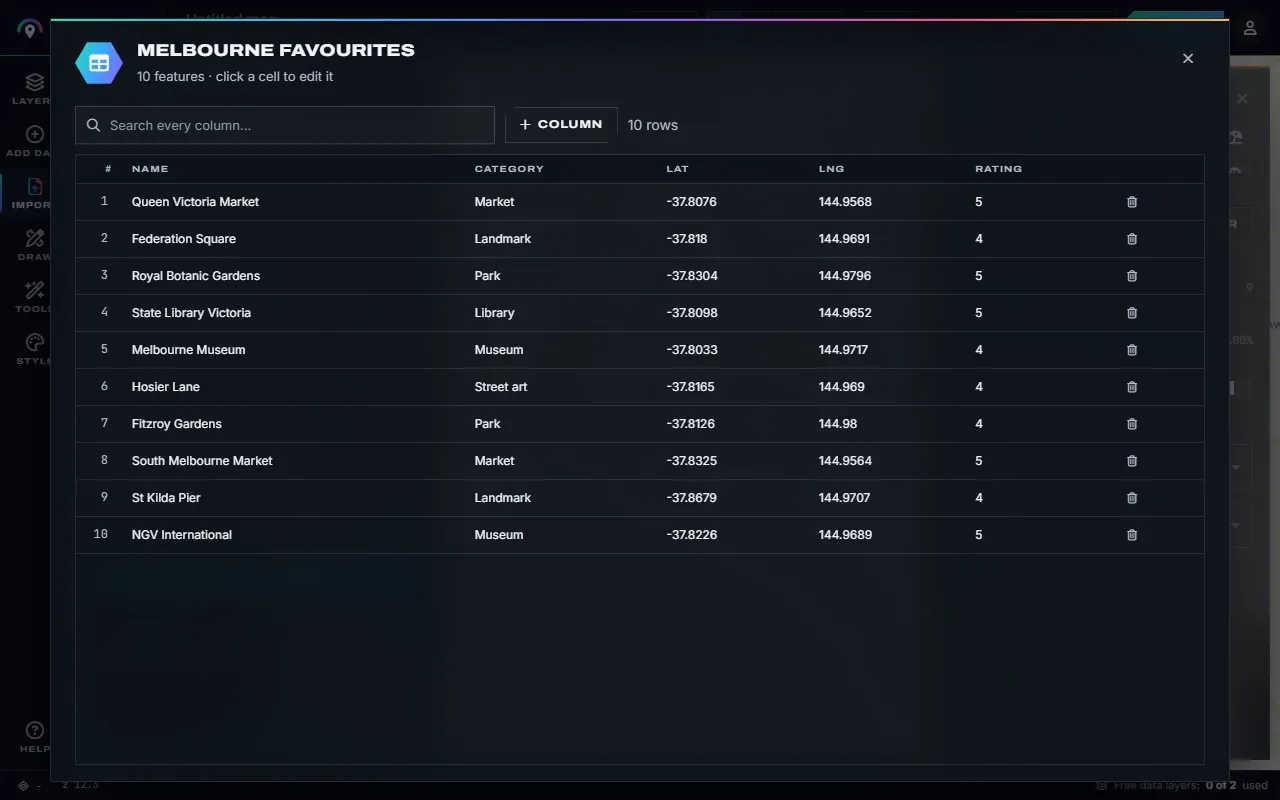
Step 6 The attribute table - every cell of your own layers can be edited.
Method 2: Drop pins by hand (up to ~50 places)
For a small, curated list – your favourite cafés in a city, wedding venues, a travel itinerary – adding pins one by one gives you full control.
- Open the pin tool. Go to the pin map maker, or open Draw in the studio and choose Pin (P).
- Search for the first place. Type its name or address into the search box; the map jumps there.
- Click to drop a pin. In the inspector, give it a name and notes, and pick a colour, an icon or emoji, and a photo if you have one.
- Repeat. Search, click, describe. New pins go into the layer chosen under Draw into.
- Organise into layers. Choose + New drawing layer under Draw into for each category ("Stay", "Eat", "See") so each can have its own icon and colour and viewers can switch categories on and off.
Method 3: Add ready-made places by country
Many "multiple location" maps are of things that are already mapped: every hospital in a state, every EV charger in a country, all the supermarkets or train stations in a city. In mapbow you can add these as a data layer in two clicks:
- Open Add data. Choose the country.
- Pick a layer type. Each shows how many places it contains. Big layers can be loaded for the whole country or one region.
- Add it. The places appear with names and, where known, addresses, phone numbers, websites and opening hours in their popups. The tile shows On map; its ✕ takes the layer off again and frees the slot.
Two data layers per map are free. Additional layers cost $5 each, once, and stay unlocked for all your maps; a Country Pass unlocks every layer for one country for $29. Browse coverage on map data by country.
Making a busy map readable
Cluster points
Clustering groups nearby points into a numbered bubble when you are zoomed out and splits them apart as you zoom in. Tick Cluster nearby points in the layer's Style tab for any layer with more than a few hundred points. Viewers instantly see where your locations concentrate.
Colour by category
Use Colour by field to give each value in a column its own colour – store type, sales rep, brand, region. A legend is created automatically. Keep to about seven categories; merge the rest into "Other".
Try a heat map or hex bins
For thousands of points where individual locations matter less than the pattern, set the layer's Show as to Heat. See the heat map guide. For counts you can read off a legend, Tools › Hex bins groups the points into equal hexagons coloured by how many each holds (hexbin map guide).
Label selectively
Labels on every point collide. Set Label each feature with on only the most important layer, keep the label size modest, and leave the rest in popups. On very large layers, labels appear only once you zoom in.
Filter what is shown
The Filter tab shows only the places that match a rule – "category is Flagship", "sales at least 50000" – without deleting anything. The layer's badge shows how many are shown. More in how to filter and analyse map data.
Set a good starting view
Use Tools › Fit to data, then Tools › Set start view, so viewers see all your locations immediately.
Going further
- Draw a radius around each location to show its service area.
- Use Tools › Nearest and click anywhere – a customer's address, say – to find the closest of your stores and how far away it is.
- Combine your locations with postcode areas and count customers per postcode with Tools › Count in areas.
- Open Data › Statistics for totals, averages and the most common values in any column.
- Turn the map into a store locator on your website.
Sharing your map
When you are happy, click the title in the top bar to name the map, press Share, switch on the link and copy it, or copy the embed code for your website. Edits show up everywhere instantly, so you can keep adding locations after you have published. With any purchase you can also export your locations to CSV, KML, GeoJSON, Shapefile and more.
Cleaning location lists before you import
- One location per row. Split cells that hold two addresses.
- Consistent categories. Spell categories the same way ("Retail", not a mix of "retail" and "RETAIL") so colour-by-field groups them correctly.
- Plain numbers for coordinates. No degree symbols, no spaces, and a dot as the decimal separator.
- Check the sign. West and south are negative. A store in New York should have a negative longitude; one in Sydney a negative latitude.
- Keep an ID column. A unique id per row makes it easy to re-import an updated list and spot what changed.
Spotted a mistake after importing? Fix it in the attribute table rather than re-importing – every cell of an imported layer can be edited.
Example: a travel map with three layers
- Create three drawing layers: "Stay", "Eat" and "See" (Draw into › + New drawing layer), each with its own icon and colour.
- Add places by searching and clicking, adding a photo and a one-line tip to each.
- Draw the route between them with the Line tool or the route map maker.
- Add context such as train stations for the city, so friends can see how to get around.
- Share the link in your group chat – everyone can open it on their phone.
Frequently asked questions
How many locations can one map have?
Thousands of points run smoothly; with clustering, tens of thousands stay usable in a normal browser.
Can I map multiple locations from Google Sheets or Excel?
Yes. Select the cells including the header row, copy, and paste them into Paste data – or drop an .xlsx or CSV file onto the map.
Can I use different colours for different locations?
Yes. Put locations in separate layers, or use Colour by field to colour by a column automatically.
Is there a limit on free pins?
No. Pins you add yourself and data you import are unlimited and free, and never use a data-layer slot.
Can viewers search my map?
Yes. Shared and embedded maps have a search box; viewers can also toggle layers in the legend and tap any location for its details.