How to Filter, Query and Analyse Data on a Map
Explore the data behind your map: browse the table, read the statistics, filter by any field, clip to an area and count, buffer or bin places in your browser.
Updated · by the mapbow team
A map with three thousand pins on it is a starting point, not an answer. The answer comes when you narrow it down – only the 4-star hotels, only the stores inside this territory, only the schools with more than 500 students – and then summarise what is left. mapbow has the tools for this built into every layer: a table of every feature, statistics, filters and a set of analysis tools that turn one layer into another. Everything runs in your browser, on your own imported data and on mapbow's ready-made layers alike.
Explore and filter a layer step by step
- Open a layer's Data tab. Select a layer (click it in Layers, or click one of its places and then Layer style) and open the Data tab.
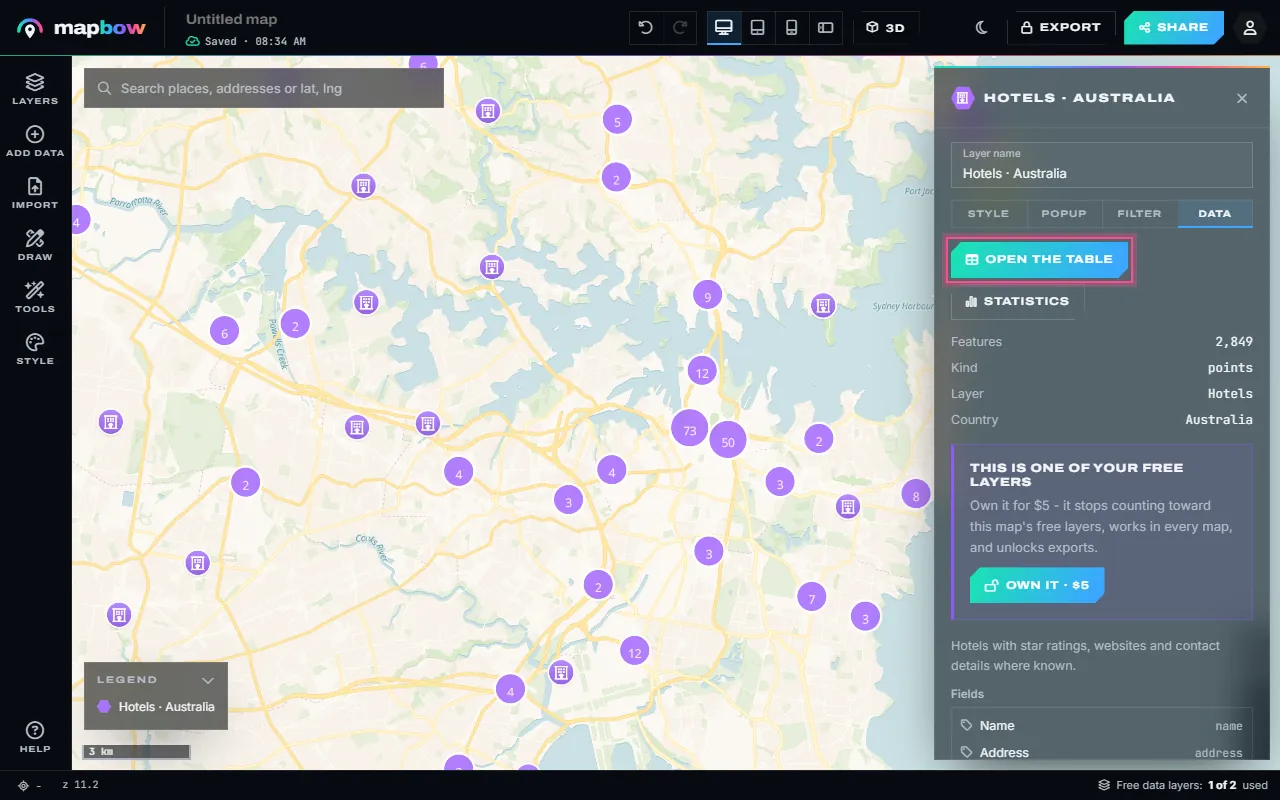
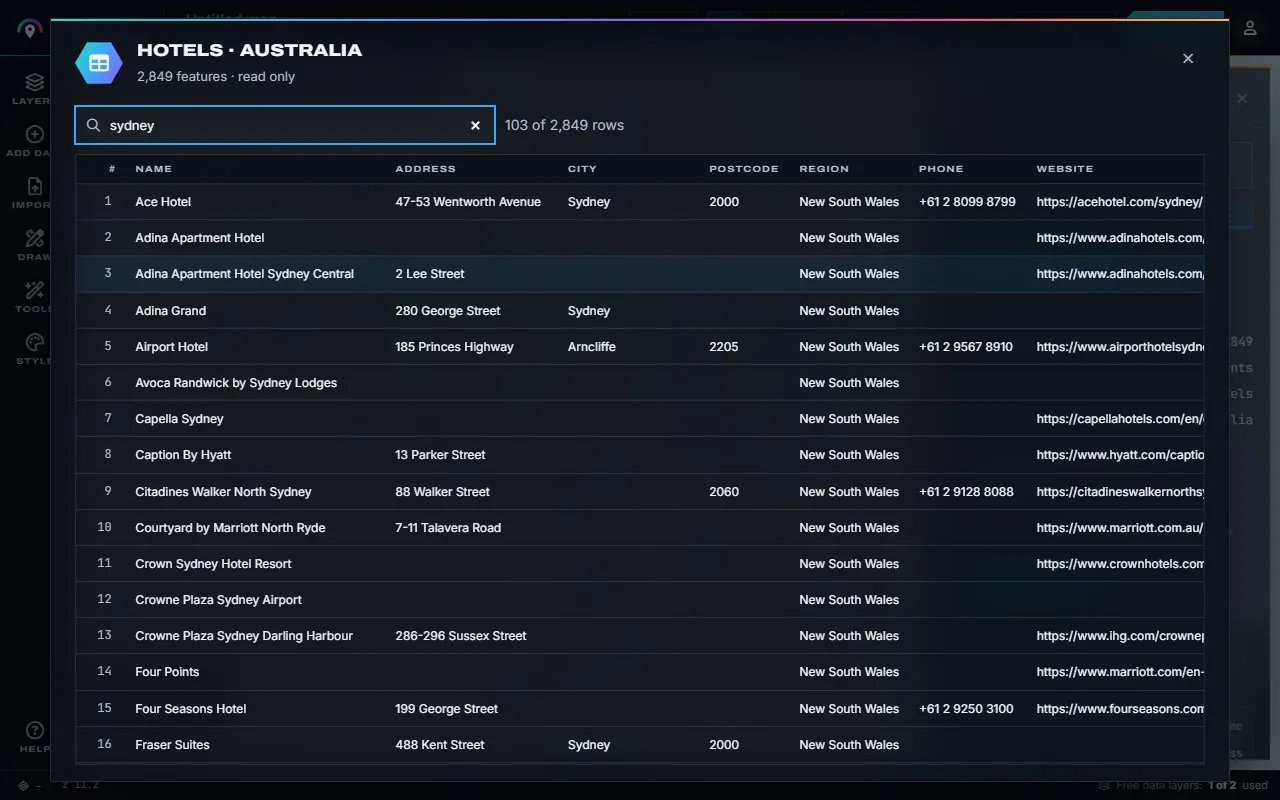
Step 1 The Data tab: the table, statistics and every field. - Browse the table. Open the table lists every feature: search across all columns, click a heading to sort, click a row number to fly to it. On your own layers every cell can be edited.
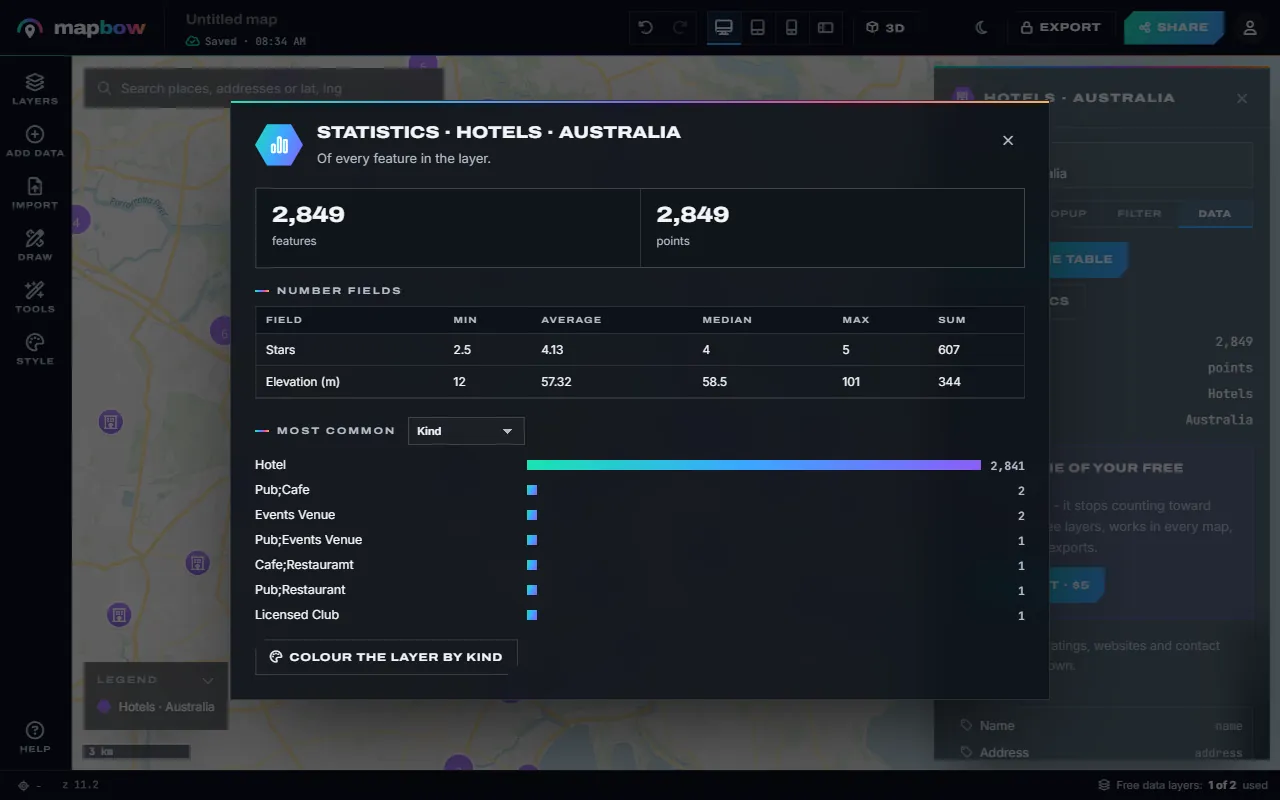
Step 2 Hotels in the table, searched for "sydney". - See the statistics. Statistics sums the layer up: how many features, total length and area for lines and shapes, the minimum, average, median, maximum and sum of every number field, and the most common values of any field.
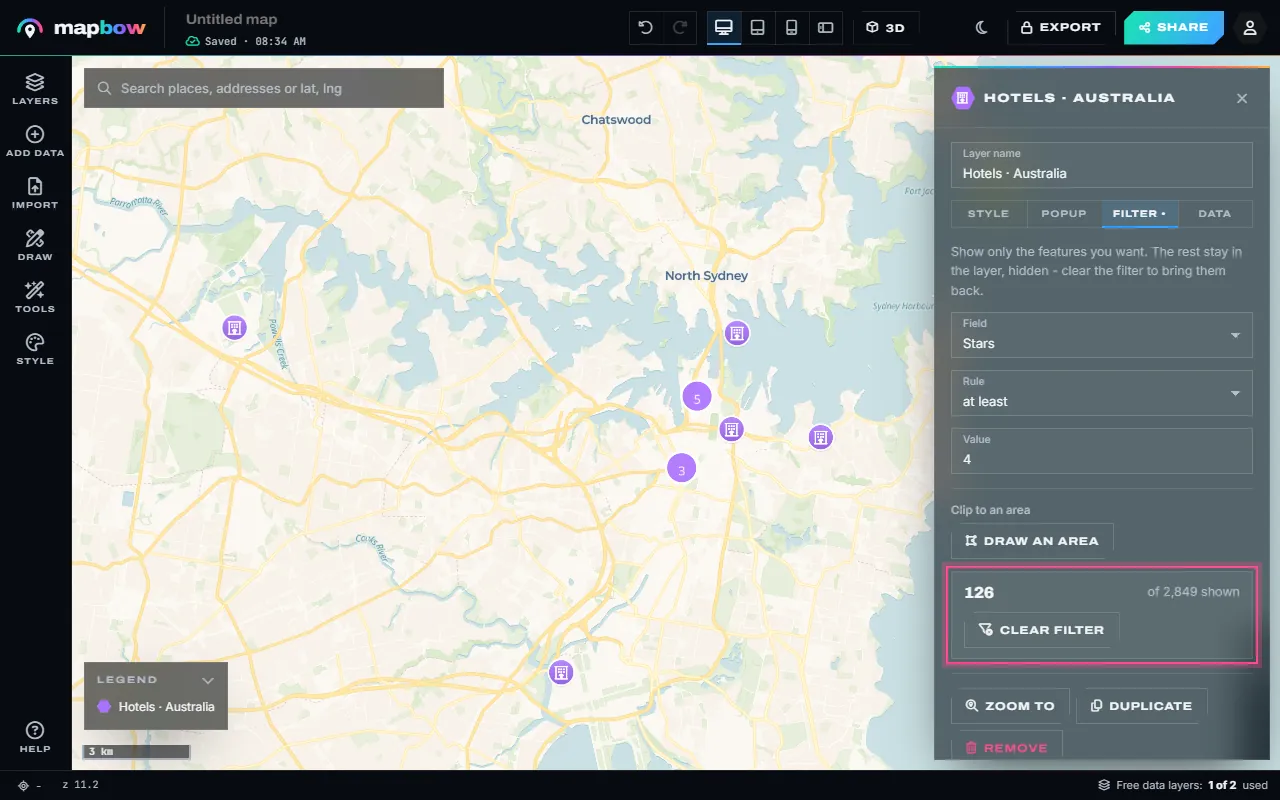
Step 3 Statistics for a layer of hotels. - Filter it. In the Filter tab choose a field and a rule - is, is not, contains, is one of, greater than, at least, less than, at most, has a value, is empty. Only the matching features stay on the map, and the count updates as you type.
Step 4 Only hotels with 4 stars or more. - Clip it to an area. Draw an area (or Use a drawn area) keeps only what is inside it - the CBD, a suburb, a sales territory. Combine it with a field filter, and clear either at any time.
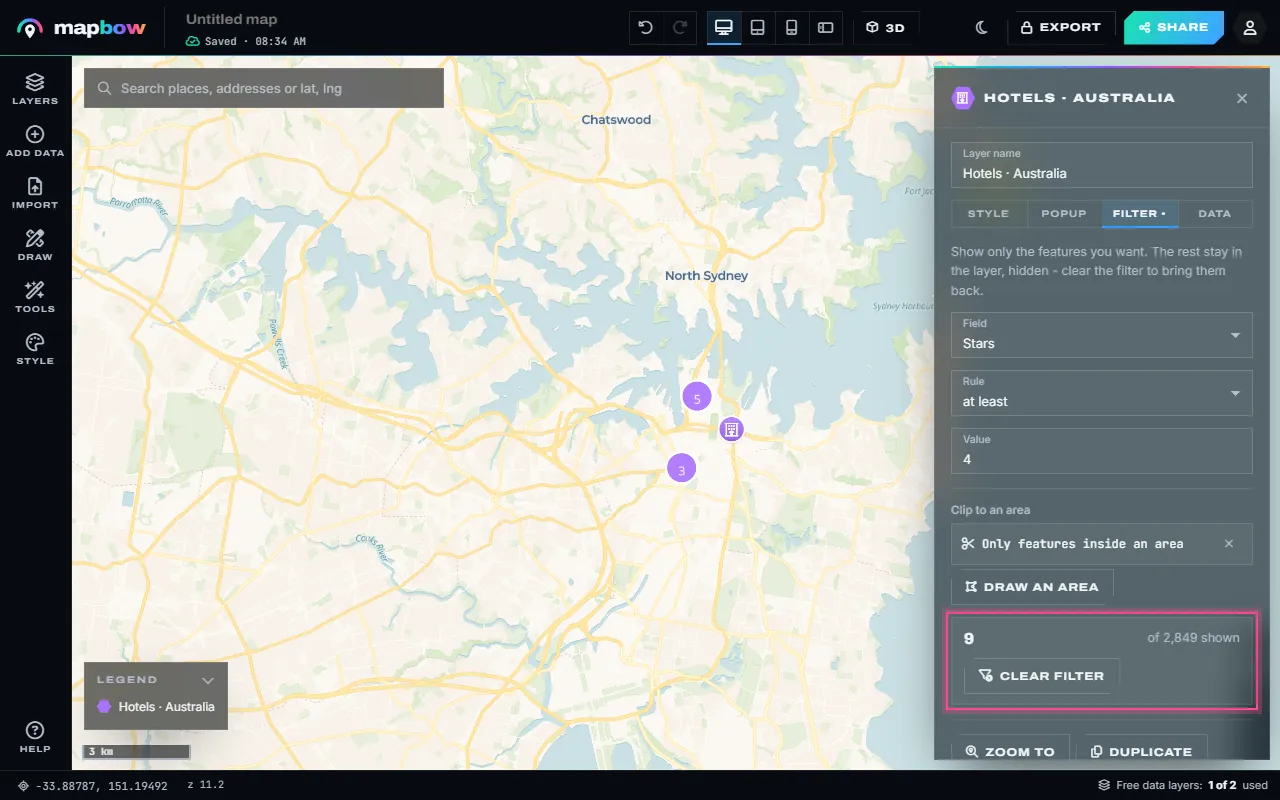
Step 5 4-star hotels inside the CBD only. - More analysis tools. The Tools panel has the rest: count points in areas, hex bins, buffers, convex hulls, bounding boxes, centroids, Voronoi zones, merging areas and simplifying shapes. They work on what the filter shows, and each creates a new layer.
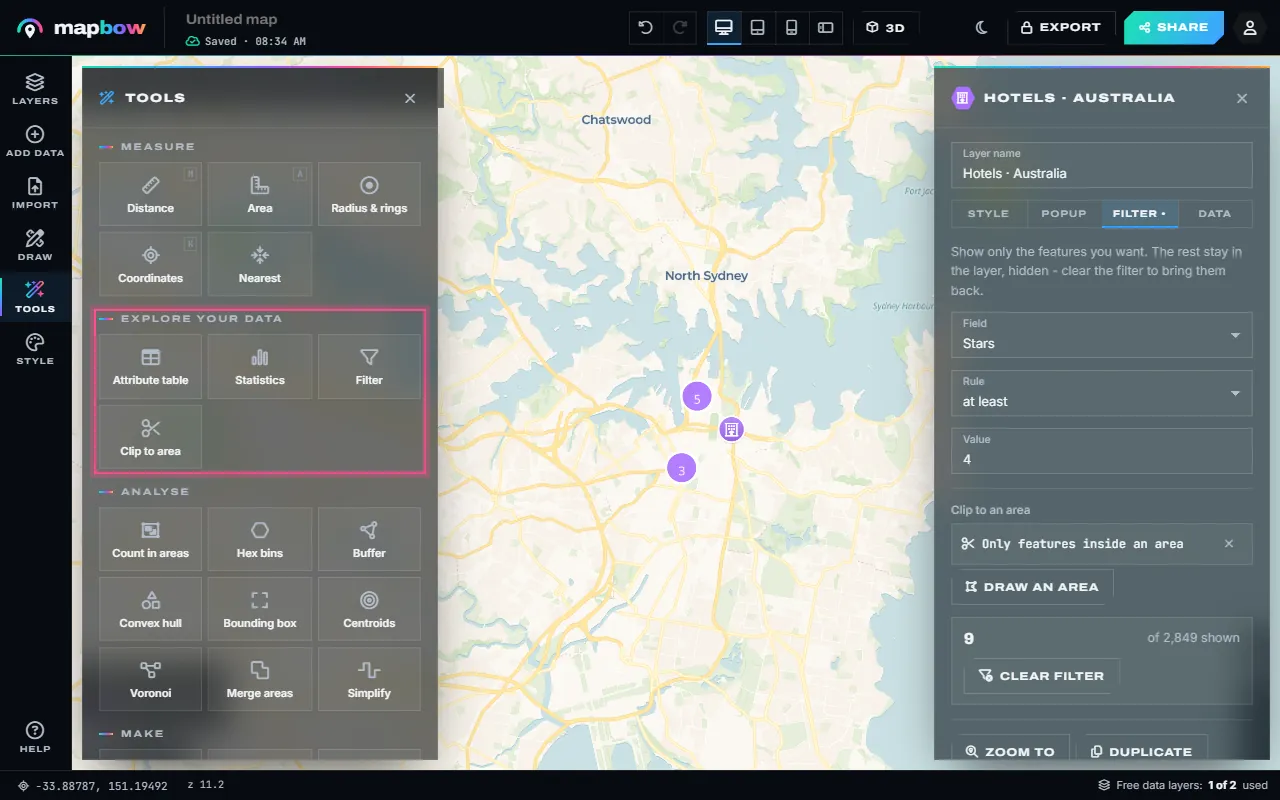
Step 6 Tools › Explore your data and Analyse.
Getting more from the table and statistics
- Find one record fast. Type a name, postcode or phone number into the table's search box – it looks in every column.
- Find the extremes. Click a heading such as stars or sales to sort, then click the row number of the top row to fly to it.
- Fix your own data in place. On imported and drawn layers you can edit any cell, add a column (for example a "Region" or "Visited" column) and delete rows. Ready-made data layers are read only.
- Turn a statistic into a map. Under Statistics, pick a field to see its most common values as bars, then use Colour the layer by that field – one click from "what is in here?" to a coloured category map.
Filter rules explained
| Rule | Use it for | Example |
|---|---|---|
| is / is not | One exact value | state is NSW |
| contains | Part of a text value | name contains "Medical" |
| is one of | Several values at once | type is one of cafe, bakery |
| greater than / at least | Numbers above a level (at least includes the value itself) | stars at least 4 |
| less than / at most | Numbers below a level | price at most 250 |
| has a value / is empty | Finding gaps or complete records | phone is empty |
The value box suggests values from the data, and the most common ones appear as quick chips. The tab shows "N of M shown", and the layer list marks a filtered layer "N shown" so you never forget a filter is on. Hidden features stay in the layer – press Clear filter and they come back. The filter is saved with the map, so the shared map shows the same places.
The analysis tools
Open Tools on the left rail. The Explore your data group opens the table, statistics, filter and clip for any layer. The Analyse group turns a layer into a new one:
| Tool | What it makes | Typical question |
|---|---|---|
| Count in areas | Areas coloured and labelled by how many points fall inside each | How many customers per postcode? |
| Hex bins | Even hexagons coloured by the number of points in each | Where are cafés densest? |
| Buffer | A zone of a set distance (km, miles or metres) around every feature, or the selected one | What is within 500 m of the rail line? |
| Convex hull | The smallest outline that contains a layer | What area do our jobs cover? |
| Bounding box | The rectangle around a layer | What extent does this data span? |
| Centroids | A point at the centre of every area or line | Where is the middle of each suburb? |
| Voronoi | Zones of the map closest to each point | Which store is nearest each area? |
| Merge areas | Touching and overlapping areas joined into one outline | What does the whole region look like? |
| Simplify | Lighter, smoother lines and outlines (your own layers, or data layers you own) | Can this detailed boundary load faster? |
Every tool works on what the layer's filter shows, so filter first and analyse second. Results are new layers you can style, filter and analyse again. For hexagons in depth, see how to make a hex bin map; for smooth density, how to make a heat map.
Worked example: premium hotels per suburb
A tourism business wants to know which Sydney suburbs have the most 4- and 5-star hotels.
- Add the layers. In Add data, choose Australia and add Hotels and Suburbs & localities (for New South Wales only, to keep it light). That uses the map's two free data layers.
- Filter the hotels. Select the hotels layer, open Filter and set stars – at least – 4.
- Clip to greater Sydney. Under Clip to an area press Draw an area and outline the metropolitan area.
- Count. Open Tools › Count in areas, pick the suburbs as the areas and the hotels as the points, and run it. A new layer appears with each suburb coloured and labelled by its number of premium hotels.
- Read and share. Click a suburb for its count, open the new layer's Statistics for the average per suburb, and press Share to send the map.
Swap hotels for your own imported customer list and suburbs for postcodes or sales territories, and the same five steps answer "where are our customers?". To draw your own areas first, see how to create a sales territory map.
Frequently asked questions
Can I filter a map by a column in my spreadsheet?
Yes. Every column you import becomes a field. Choose it in the layer's Filter tab with a rule such as is, contains, at least or is empty.
Does filtering delete my data?
No. Hidden features stay in the layer. Press Clear filter to show them again.
How do I count points inside areas?
Use Tools › Count in areas. Pick an areas layer and a points layer; the result is a new layer coloured by count, with the count in each popup.
Can I edit the attribute table?
On your own imported and drawn layers, yes: edit cells, add columns and delete rows. Ready-made data layers are read only.
Do I need GIS software for this?
No. Filtering, statistics and the analysis tools all run in your browser. If you want to continue in QGIS or ArcGIS, you can export the layers.