How to Make a Heat Map of Locations
Make a geographic heat map from a spreadsheet or ready-made place data. Choose radius, weight and colours, avoid misleading density maps, and share it.
Updated · by the mapbow team
A heat map turns a cloud of points into a smooth surface of colour: hot where points crowd together, cool where they are sparse. It is the fastest way to see patterns in large location datasets – where customers are, where incidents happen, where a city's cafes cluster. This guide shows how to make one in mapbow, how to choose the settings, and how to avoid the classic heat map traps.
What you need
Any set of points. That could be:
- Your own data – orders, customers, sightings, complaints, sensor readings – as an Excel or CSV file with latitude and longitude (or addresses), or a GeoJSON, KML, KMZ, GPX or zipped Shapefile file. Importing is free and never uses a data layer slot.
- A built-in layer – for example restaurants, cafes, bus stops, EV chargers or hotels for a country.
Heat maps shine from a few hundred points upwards. With fewer than 50, plain markers are usually clearer.
Step by step
- Add points. Open the studio and add a layer of points: a ready-made layer from Add data (here cafés in Australia) or your own spreadsheet from Import.
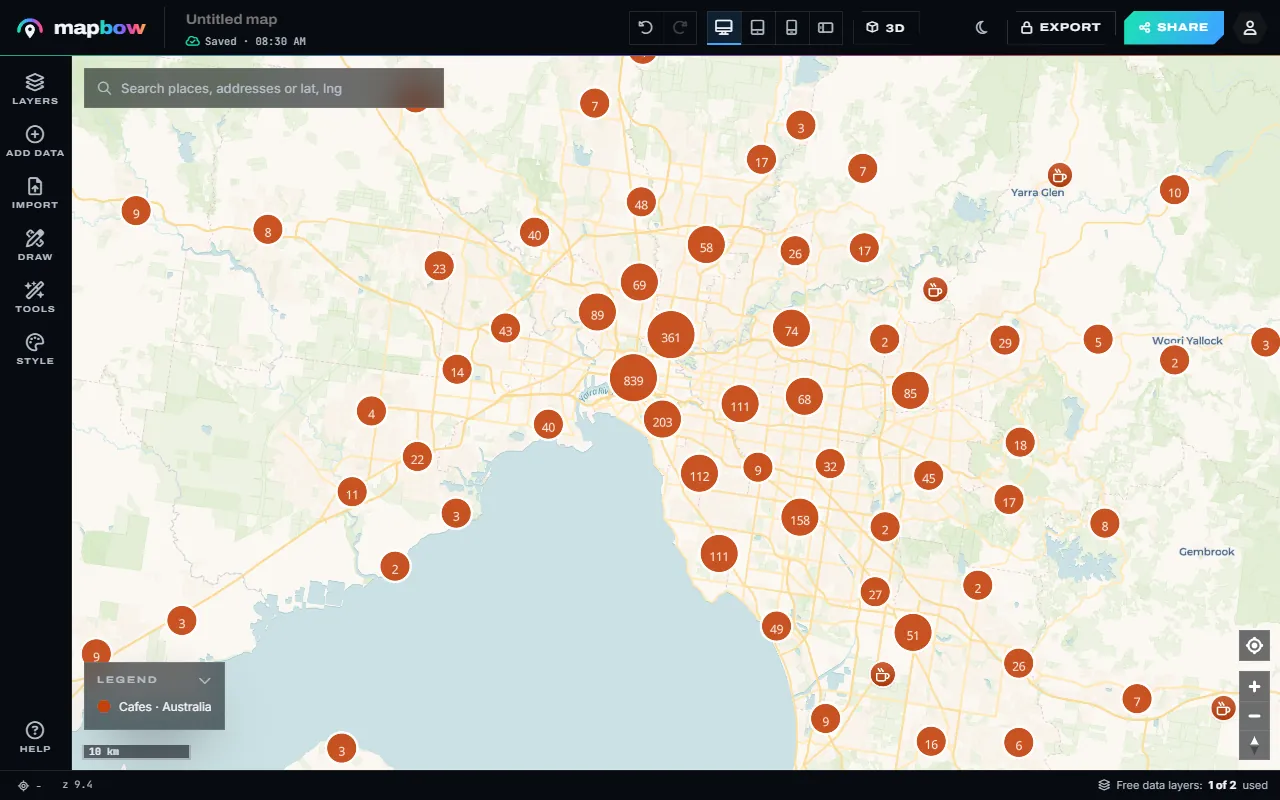
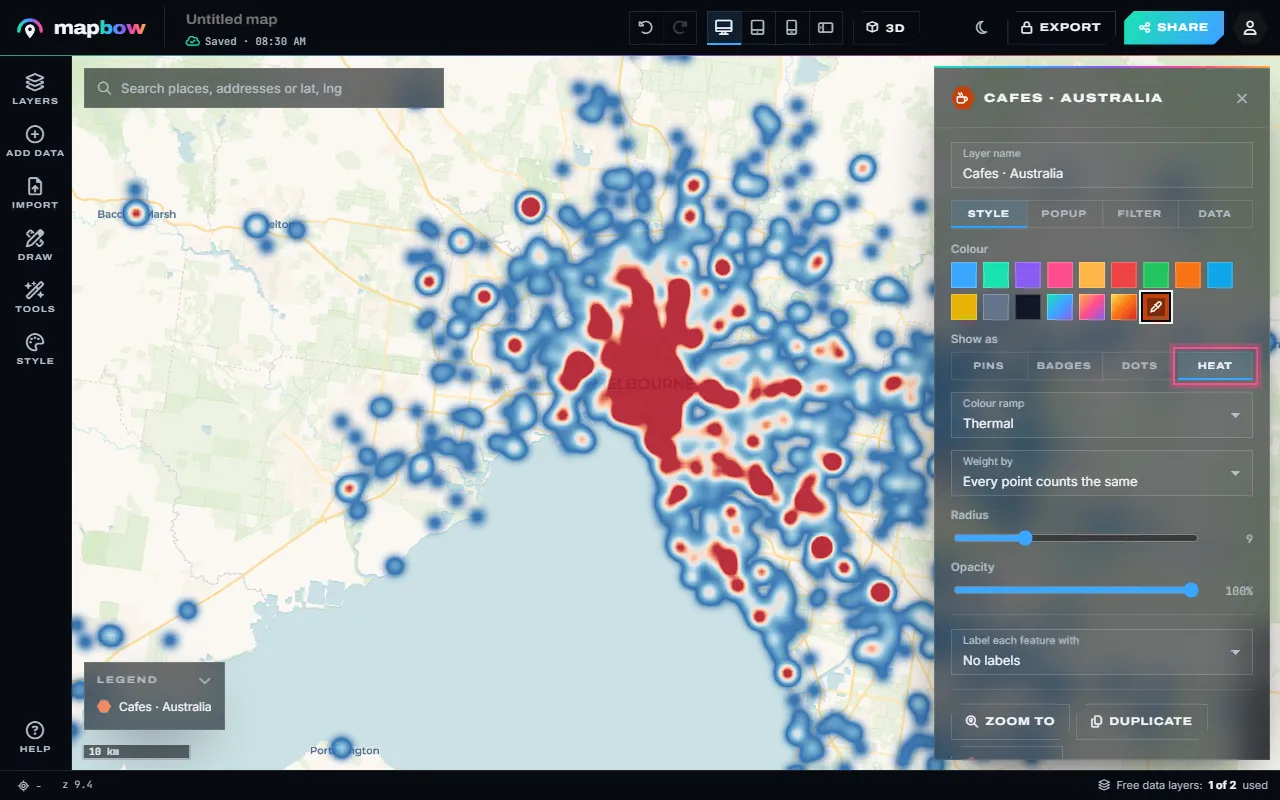
Step 1 Cafés in Melbourne as clustered points. - Switch it to Heat. Select the layer and, in its Style tab under Show as, choose Heat. (Tools › Heat map does the same in one click.) The points become a heat map that stays readable at every zoom.
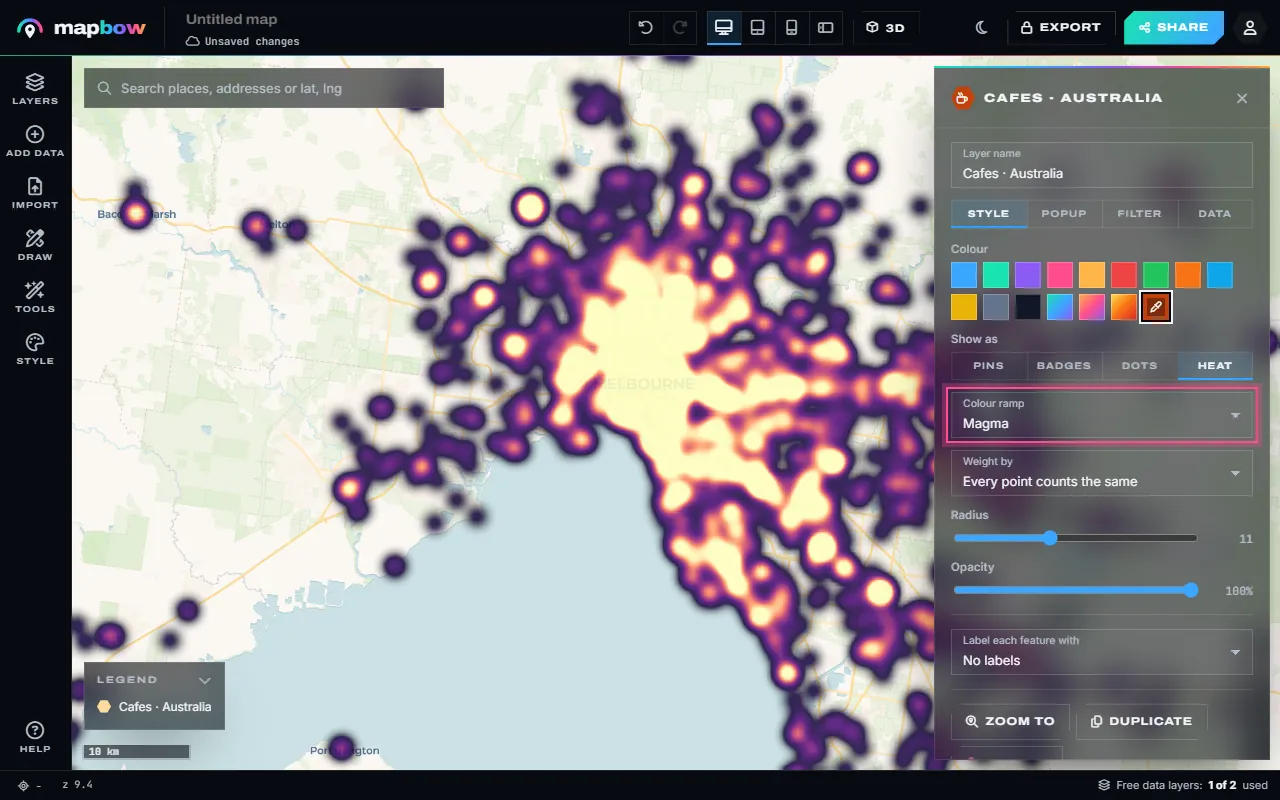
Step 2 Show as › Heat. - Tune the colours and radius. Pick a colour ramp (Thermal, Viridis, Magma or Ocean), set the radius and opacity, and weight the heat by a number field if the layer has one.
Step 3 The Magma ramp with a larger radius. - Or count them in hexagons. For exact counts instead of a glow, use Tools › Hex bins: choose the layer and the hexagon size.
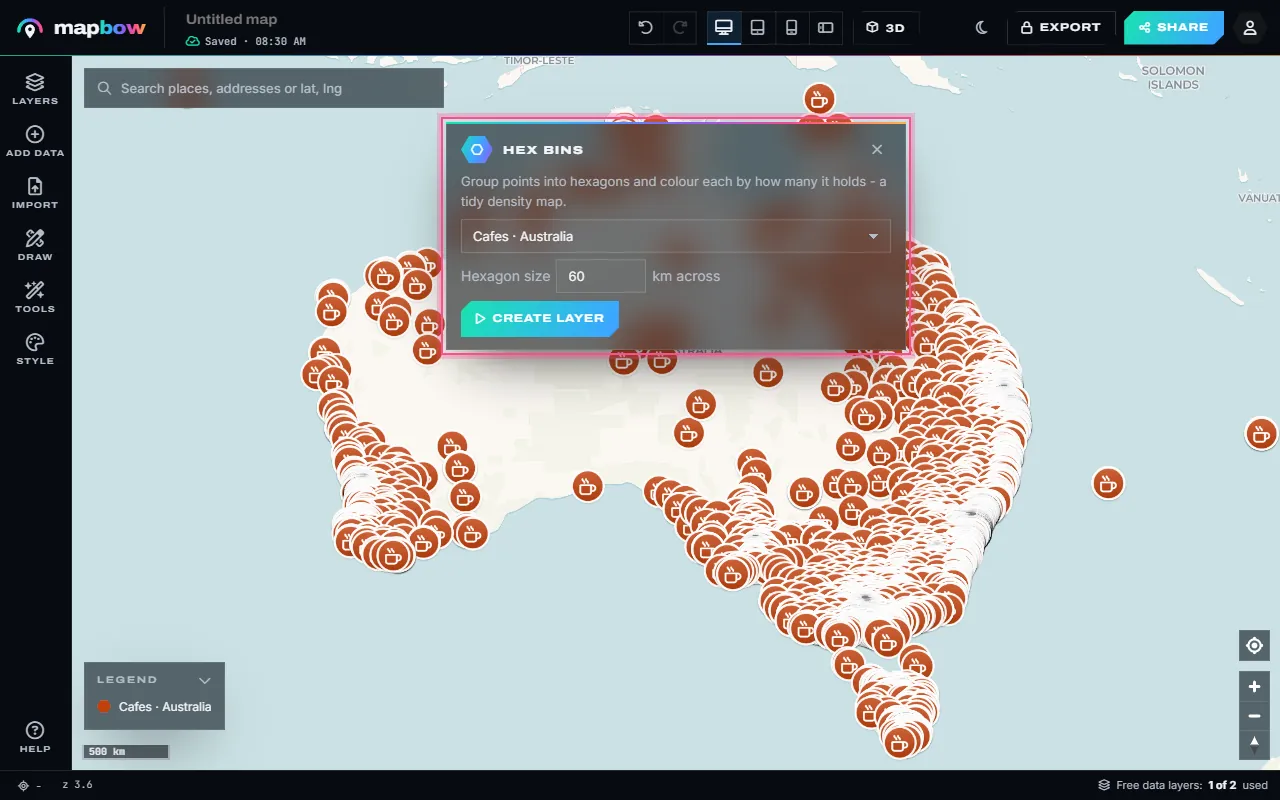
Step 4 Tools › Hex bins with 60 km hexagons. - A hex bin map. Each hexagon is coloured by how many points it holds, with a legend. Click one to see its count. The hex bin map guide covers this in detail.
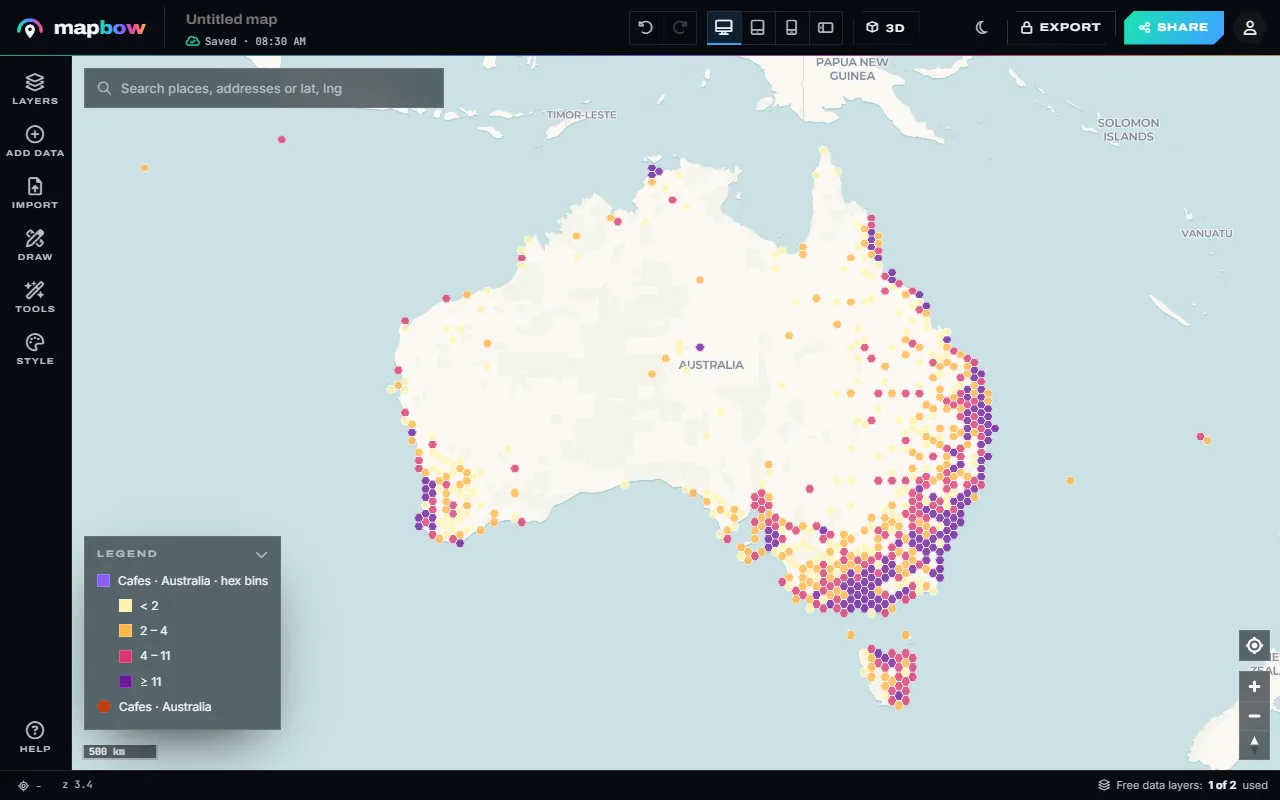
Step 5 Cafés across Australia in 60 km hexagons.
When you are happy, check the phone preview in the top bar, then press Share for a link or embed code.
Choosing settings
| Situation | Radius slider | Opacity |
|---|---|---|
| City-level view of many points (e.g. cafes in one city) | Low (6–10) | 80–100% |
| Country-level view (e.g. chargers nationwide) | Middle (10–15) | 80–100% |
| Sparse data (a few hundred points over a large area) | High (15–22) | 100% |
| Heat over a detailed basemap you still need to read | Any | 50–70% |
A smaller radius shows local hot spots; a larger one reveals regional patterns. mapbow heat maps adapt on their own as well: the glow grows as you zoom in, so the map stays readable at every scale, and on very large layers each point glows more gently so tens of thousands of points don't melt into one red blob. There is no separate intensity setting to fight with.
To keep individual places clickable as well, press Duplicate on the layer and show the copy as Dots on top of the heat.
Avoiding misleading heat maps
Heat maps are persuasive, which makes them easy to misuse.
The population trap
A heat map of almost anything – crime, pizza shops, dentists – looks like a population map, because more things happen where more people live. If you want to know where something is unusually common, compare it with population, or use a region map shaded by a rate (per 10,000 residents). See colouring a map by region.
Settings change the story
A bigger radius makes patterns look smoother and bigger. When comparing two heat maps, use identical settings.
Edges and empty areas
No heat doesn't always mean nothing is there – it might mean nothing was recorded. Be clear about where your data comes from and what it covers.
Heat map ideas
- Retail site selection: overlay a competitor heat map with your own stores.
- Gap analysis: a heat map of pharmacies or defibrillators shows underserved areas as cold spots.
- Tourism: where attractions, hotels and restaurants concentrate.
- Operations: deliveries, call-outs or support tickets by location.
- Real estate: amenities around a suburb.
Heat map, hex bins, cluster map or choropleth?
| Map type | Shows | Use when |
|---|---|---|
| Heat map | Density as a smooth surface | Many points, you care about the pattern |
| Hex bin map | Equal hexagons coloured by exact counts | Many points, you want numbers you can quote |
| Cluster map | Numbered groups that split as you zoom | Many points, viewers need individual details |
| Choropleth (region map) | Areas shaded by a value | You want to compare areas fairly |
For a cluster map, keep the layer as pins and turn on Cluster nearby points in its Style tab. For a region map, use Tools › Count in areas with a boundary layer.
Preparing your data
- Clean the coordinates. Remove rows with blank or zero coordinates – a cluster of points at 0,0 off the coast of West Africa is a classic sign of missing data.
- Remove duplicates. Duplicate rows double the heat at a location.
- Decide on weight. If every point is one event, no weight is needed. If points represent different amounts (orders of different value, sites with different visitor numbers), add a numeric column and choose it under Weight by.
- Check the extent. Points far outside your area of interest stretch the initial view; remove them first, or hide them with the layer's Filter tab (Clip to an area works well).
Comparing two heat maps
To compare, say, your customers with a competitor's locations, put both on one map with the same radius and opacity, and give each its own colour ramp – or make two maps with identical settings and views and share them side by side. Changing settings between them makes the comparison meaningless.
Presenting a heat map
- Add a short note under Style › About this map explaining what the heat represents and the period covered.
- Keep a reference layer visible – state borders or major cities – so viewers can orient themselves.
- For reports, export a PNG or PDF (exports unlock with any purchase) at a fixed, labelled view.
Frequently asked questions
How do I make a heat map from Excel?
Make sure your sheet has latitude and longitude columns (or addresses), drop the .xlsx file onto Import – or copy the cells and paste them – then set the layer's Show as to Heat.
How many points do I need?
A few hundred or more works best. Heat maps handle tens of thousands of points smoothly.
Can I weight a heat map by sales or population?
Yes. In the layer's Style tab, pick a number column under Weight by.
What is the difference between a heat map and a hex bin map?
A heat map is a smooth glow showing density. A hex bin map counts the points in equal hexagons, so you can read exact numbers. Use Tools › Hex bins for one.
Can I share or embed a heat map?
Yes, free – with a link or embed code. PNG and PDF export come with any data layer purchase.
Why does my heat map look like a population map?
Because most things are more common where more people live. Normalise by population, or compare areas with a choropleth.