How to Make a Hexbin Map (Hexagon Density Map)
Make a hexbin map: group thousands of points into hexagons coloured by count, choose a size, read the classes, extrude them in 3D and avoid the pitfalls.
Updated · by the mapbow team
A hexbin map (or hex bin map) covers the map in a grid of equal hexagons and colours each one by how many points fall inside it. It is one of the clearest ways to show where things are concentrated – cafés, crimes, customers, incidents, sightings – when there are far too many points to read one by one. Unlike a heat map, every hexagon holds a real count you can click and check; unlike a map coloured by suburbs or postcodes, every cell is the same size, so big rural areas do not dominate the picture.
Making a hexbin map step by step
- Add a layer of points. Any points work: a ready-made layer from Add data or your own CSV or Excel file from Import. Here: cafés in Australia.
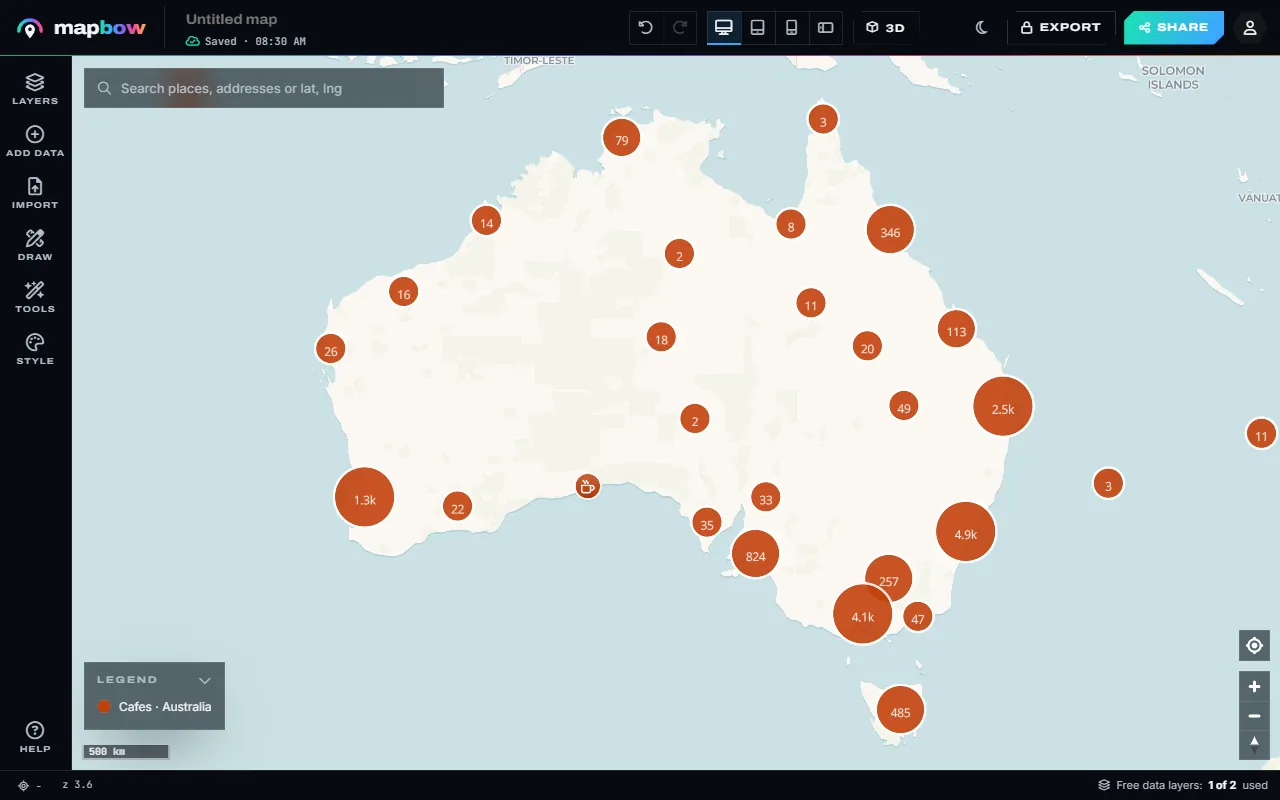
Step 1 Thousands of cafés - too many to read one by one. - Open Hex bins. Open Tools and choose Hex bins under Analyse.
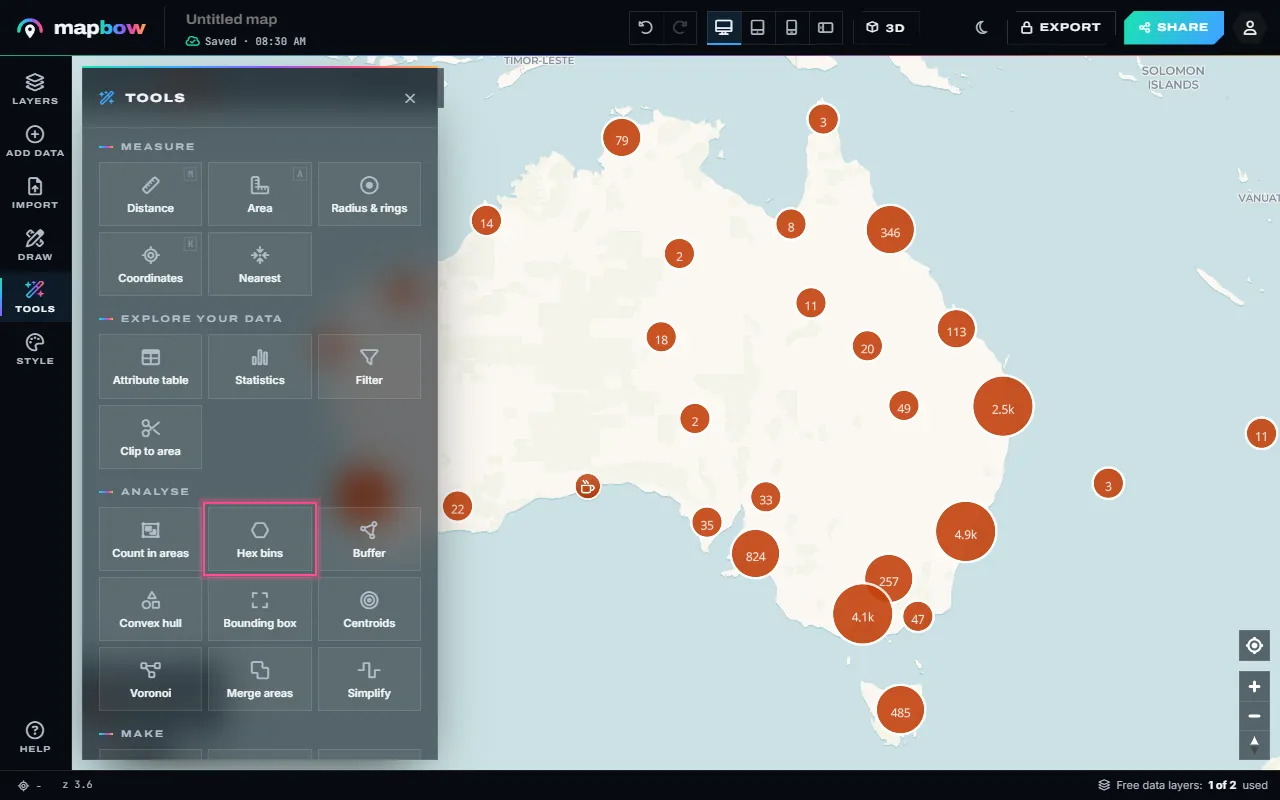
Step 2 Tools › Analyse › Hex bins. - Choose the size. Pick the points layer and the width of each hexagon in kilometres (Hexagon size … km across), then press Create layer. Smaller hexagons show more detail; bigger ones smooth out noise. For a whole country, 30-60 km works well; zoomed in on one city, 1-3 km.
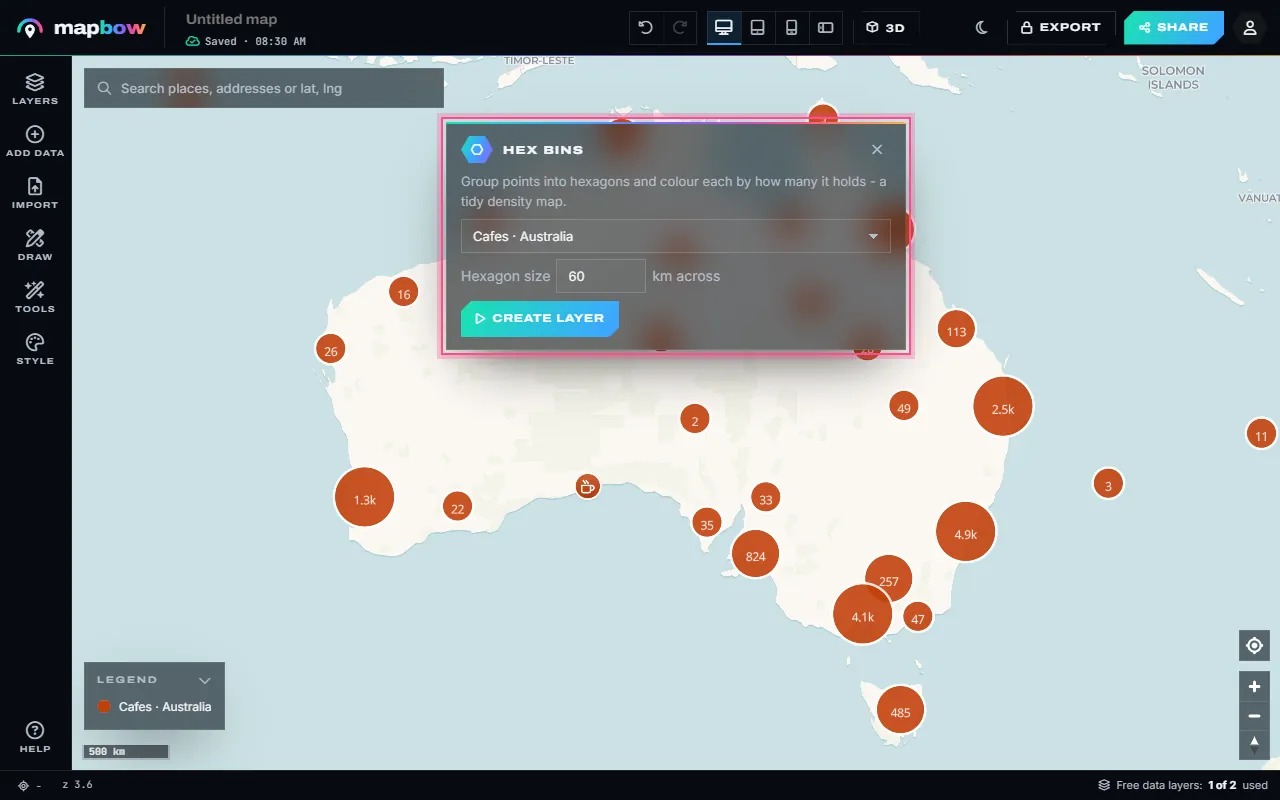
Step 3 One layer, 60 km hexagons. - Read the map. A new layer appears with one hexagon wherever there is at least one point, coloured in quantile classes from fewest to most, with a legend. Click a hexagon to see its count.
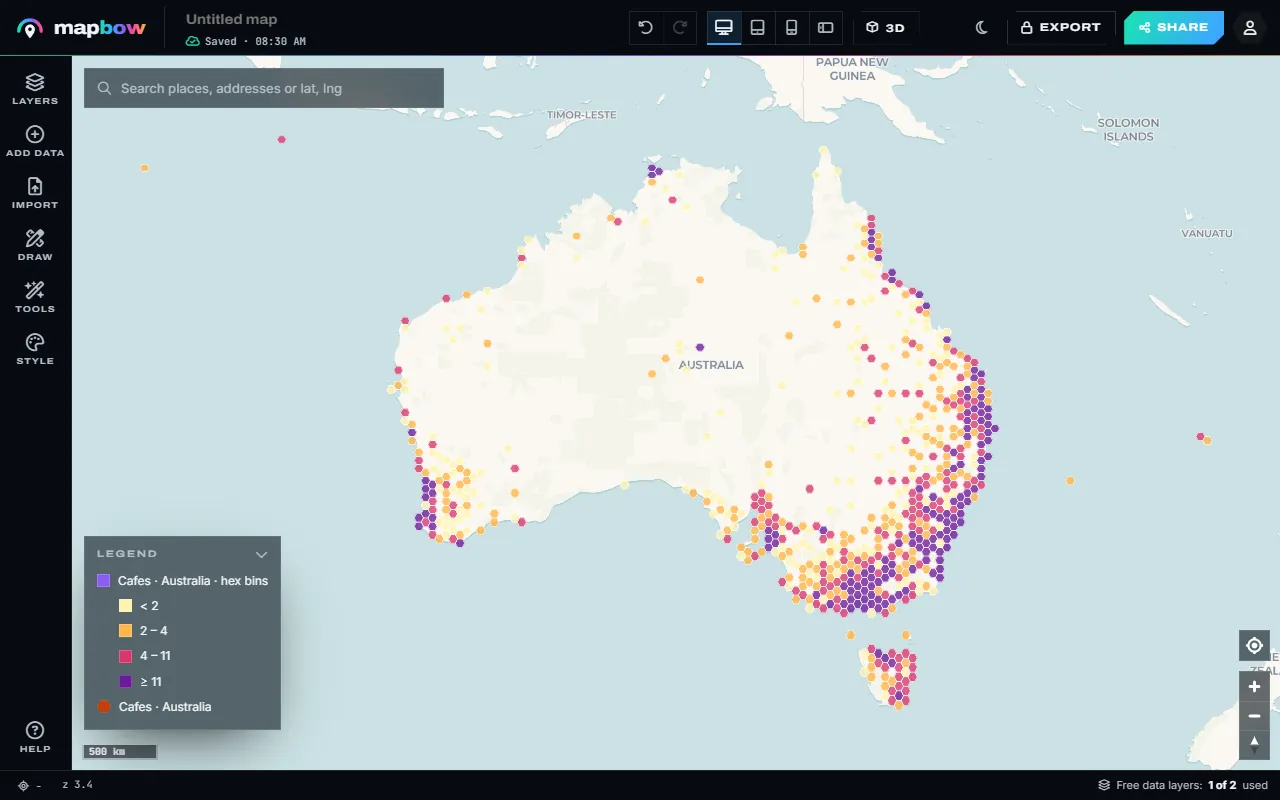
Step 4 The hex bin layer and its legend. - Restyle it - even in 3D. Select the layer to change the palette or the classes. Turn on Extrude in 3D and set Height by to count for a 3D bar map.
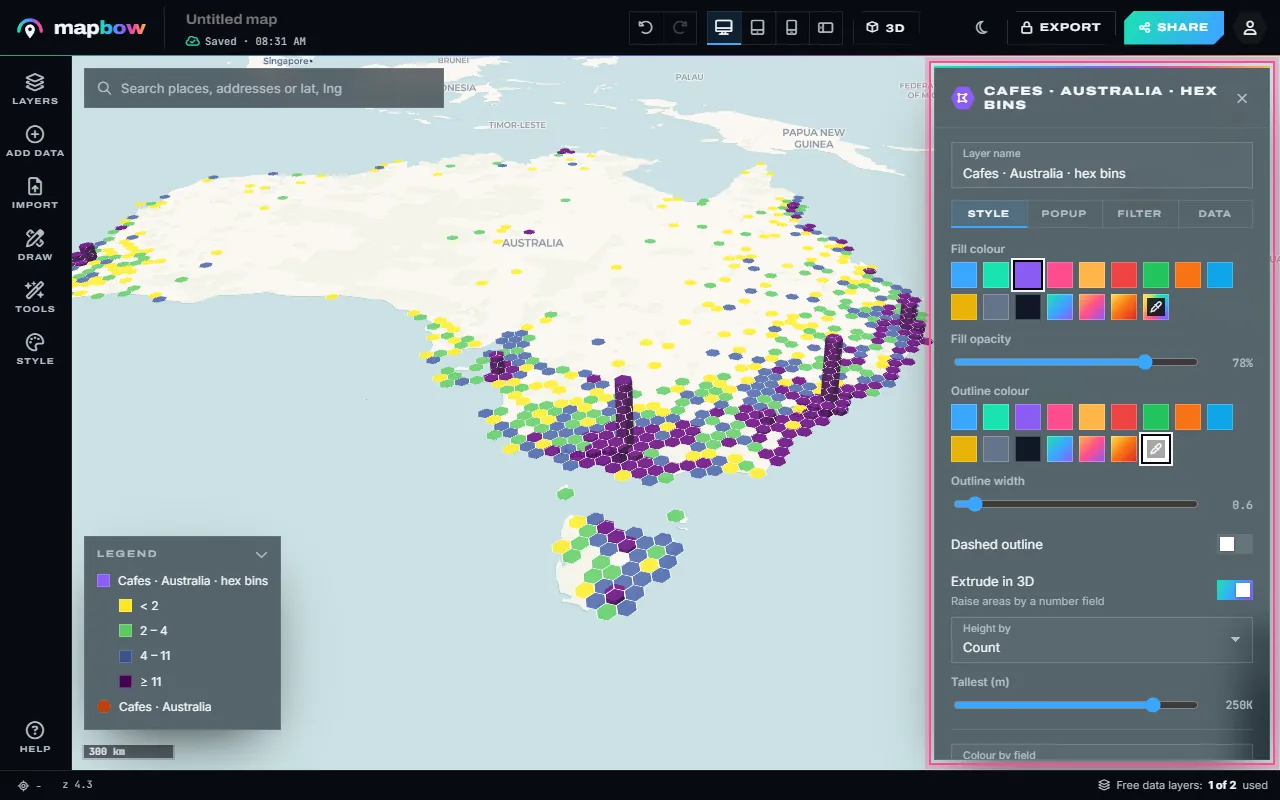
Step 5 Viridis colours, extruded by count.
Hexbins vs heat maps vs coloured regions
| Hex bin map | Heat map | Count in areas (choropleth) | |
|---|---|---|---|
| Shape | Equal hexagons | Smooth glow | Real boundaries: suburbs, postcodes, states |
| Exact numbers | Yes - each hexagon has a count | No - colour only | Yes - each area has a count |
| Fair comparison | Yes - every cell is the same size | Depends on radius and zoom | Big areas tend to collect more points |
| Best for | Density you can measure | A quick, attractive overview | Reporting by areas people know |
Use a heat map when the impression matters more than the numbers, and Count in areas (see filtering and analysing map data) when your audience thinks in postcodes or sales regions. Choose hex bins when you want honest, comparable counts.
Choosing the hexagon size
The size is the single biggest decision. Too small and most hexagons hold one or two points, so the map looks speckled and random. Too large and real patterns – a busy high street, a cluster of clinics – disappear into one cell. A good rule: pick a size where the busiest hexagons hold dozens of points and most hold several.
| Area shown | Hexagon size to try |
|---|---|
| A whole country | 30-60 km |
| A state or province | 10-25 km |
| A metropolitan area | 2-5 km |
| A city centre or town | 0.5-1 km |
It takes a few seconds to try another size, so make two or three versions and keep the clearest. If the size you ask for would create too many hexagons, mapbow asks you to pick a bigger size or narrow the data to a region – a filter or clip does that, because Hex bins works on what the filter shows.
Reading the classes
The new layer is coloured by its count field in quantile classes using the Sunset palette. Quantiles put roughly the same number of hexagons in each class, so the legend's breaks are often uneven – for example < 2, 2 – 4, 4 – 11, ≥ 11. That is deliberate: point data is usually skewed, with a few very busy cells and many quiet ones, and quantiles stop the busy few from turning everything else the same pale colour. When many hexagons share the same count, some breaks merge and you see fewer classes.
To change it, select the layer and open Style › Colour by field. You can switch to equal steps, natural breaks or manual breaks, change the number of classes and pick another palette. Manual breaks are useful when the numbers have a meaning, such as "1", "2-9" and "10 or more".
Hexbins in 3D
Turn on Extrude in 3D in the layer's Style tab and set Height by to count. Each hexagon becomes a column whose height is its count, so the busiest areas stand up like a city skyline. Press 3D in the top bar, or right-drag to tilt, to see it at an angle. 3D hexbins are great for presentations and social posts; for precise reading, a flat map with a clear legend is easier. See how to make a 3D map for more on tilting and terrain.
Pitfalls to avoid
- Edge effects. Hexagons on a coastline or border are partly sea or another country, so they hold fewer points than an inland cell with the same density. Read low counts along edges with care.
- Sparse data. Hexagons only appear where there is at least one point. With a few hundred points spread over a country, the map is mostly single, scattered cells – use a bigger size, or show the points themselves.
- Counting people, not patterns. More people means more cafés, more crimes and more customers. A hexbin of almost anything looks like a population map. Compare like with like, or put your count next to a reference layer.
- The grid changes the story. Shift the size a little and clusters can split or merge. If a conclusion depends on one hexagon, check it at a second size.
- Mixed layers. Hex bins counts points only. Lines and areas in the same layer are ignored.
Bringing your own points? See how to import an Excel or CSV file. When the map is ready, embed it on your website.
Frequently asked questions
What is a hexbin map?
A map that groups points into a grid of equal hexagons and colours each hexagon by how many points it contains.
Why hexagons instead of squares?
Hexagons are the most circle-like shape that tiles without gaps, and every neighbour is the same distance from the centre, so clusters look natural rather than blocky.
What size should my hexagons be?
Big enough that most hexagons hold several points: around 30-60 km for a country, 2-5 km for a city region and under 1 km for a town centre. Try two or three sizes.
Can I make a hexbin map from my own spreadsheet?
Yes. Import your CSV or Excel file (free and unlimited), then run Tools › Hex bins on the imported layer.
Can I make a 3D hexbin map?
Yes. Select the hex bin layer, turn on Extrude in 3D and set Height by to count.