How to Color a Map by Region (Countries, States, Counties)
Make a colour-coded map of countries, states, counties or postcodes. Click to colour or shade by data (choropleth), choose good palettes and add a legend.
Updated · by the mapbow team
Colour-coded region maps are everywhere: countries you have visited, states where a law applies, election results, sales by county. There are two ways to make one – click regions to colour them by hand, or shade them automatically from data (a choropleth). This guide covers both, plus the colour choices that make them readable.
Choose your regions
- World countries – free on every map and never counted toward your data layers.
- States & provinces – first-level regions for any country.
- Districts & counties – second-level areas.
- Municipalities and suburbs – local detail.
- Postcode areas – where available.
Pick the coarsest level that answers your question. A national story rarely needs postcodes. Boundary layers come from Add data: pick the country, then the layer. Each map can use two data layers free.
Method 1: Click to colour
- Start with Colour regions. In the studio, on the start screen choose Colour countries or regions (or Tools › Colour regions, or the colour map maker). The free World countries layer is added for you.
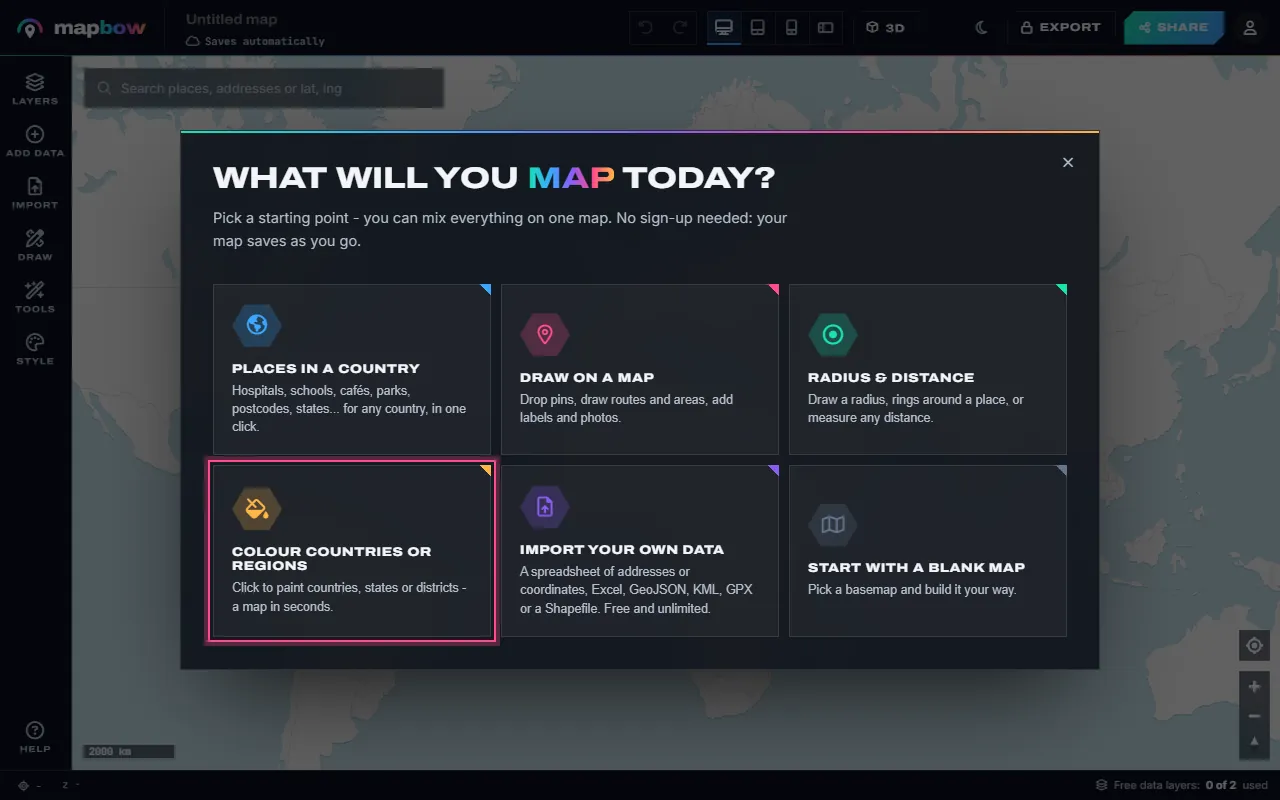
Step 1 The start screen's Colour countries or regions. - Pick a colour and click. Choose a colour in the card, then click countries to paint them. Click again (or use the eraser) to clear one. Each colour can mean something different. To paint states, counties or postcodes instead, add that boundary layer and choose it in the card.
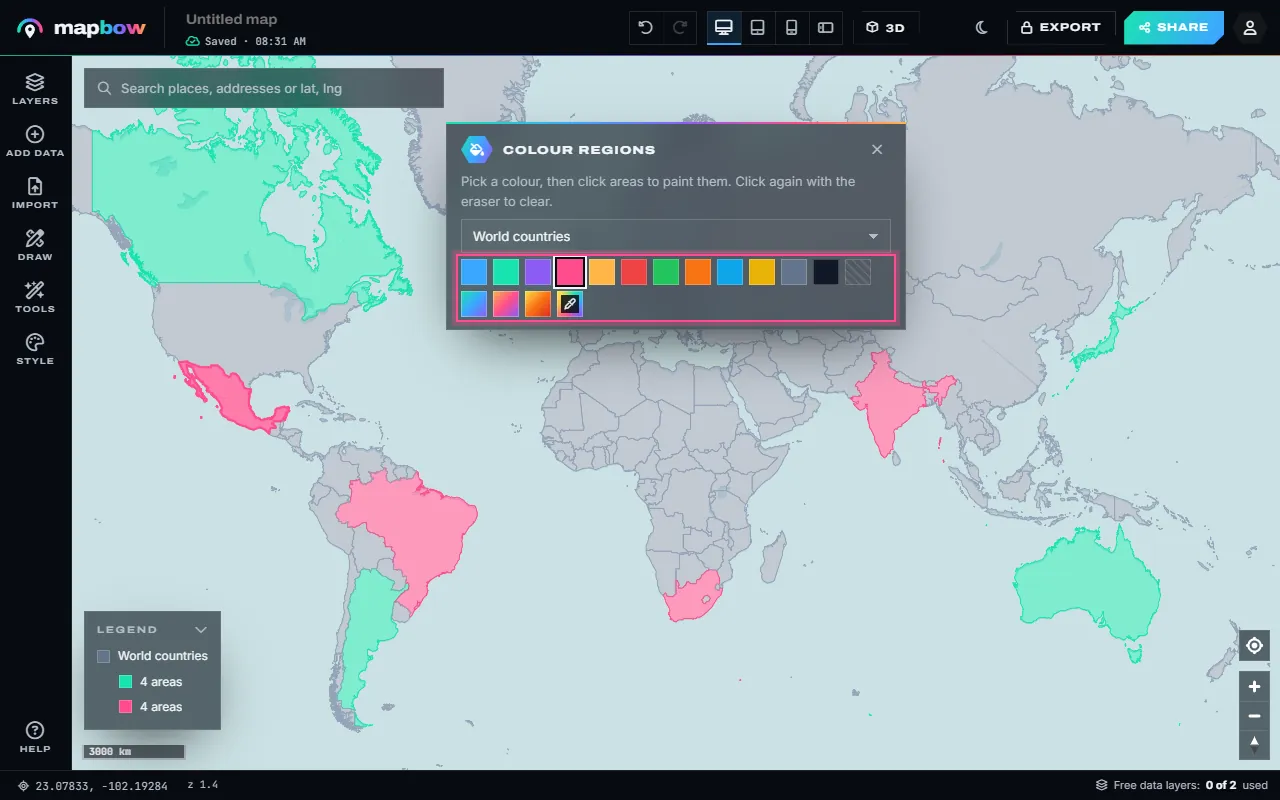
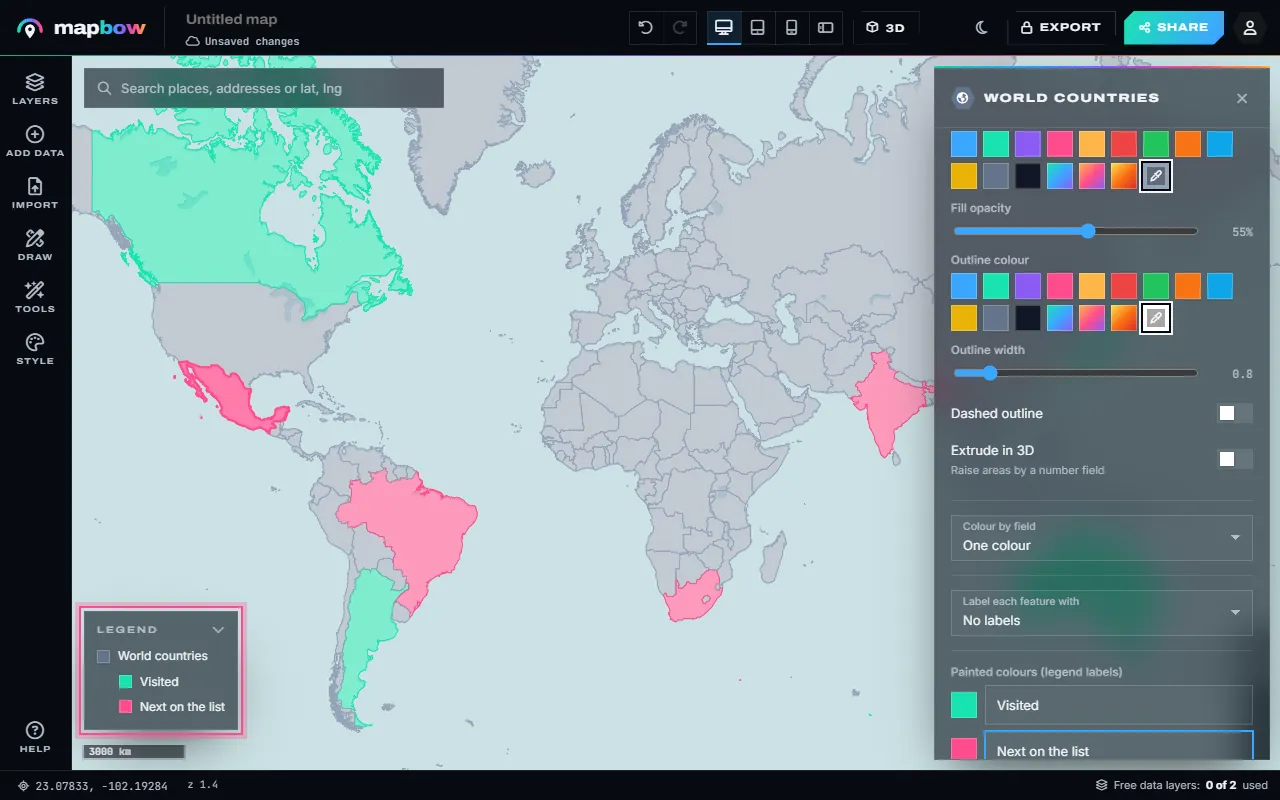
Step 2 Two colours painted on the world map. - Name the colours. Select the layer: under Painted colours give each colour a label. The labels appear in the legend of your map.
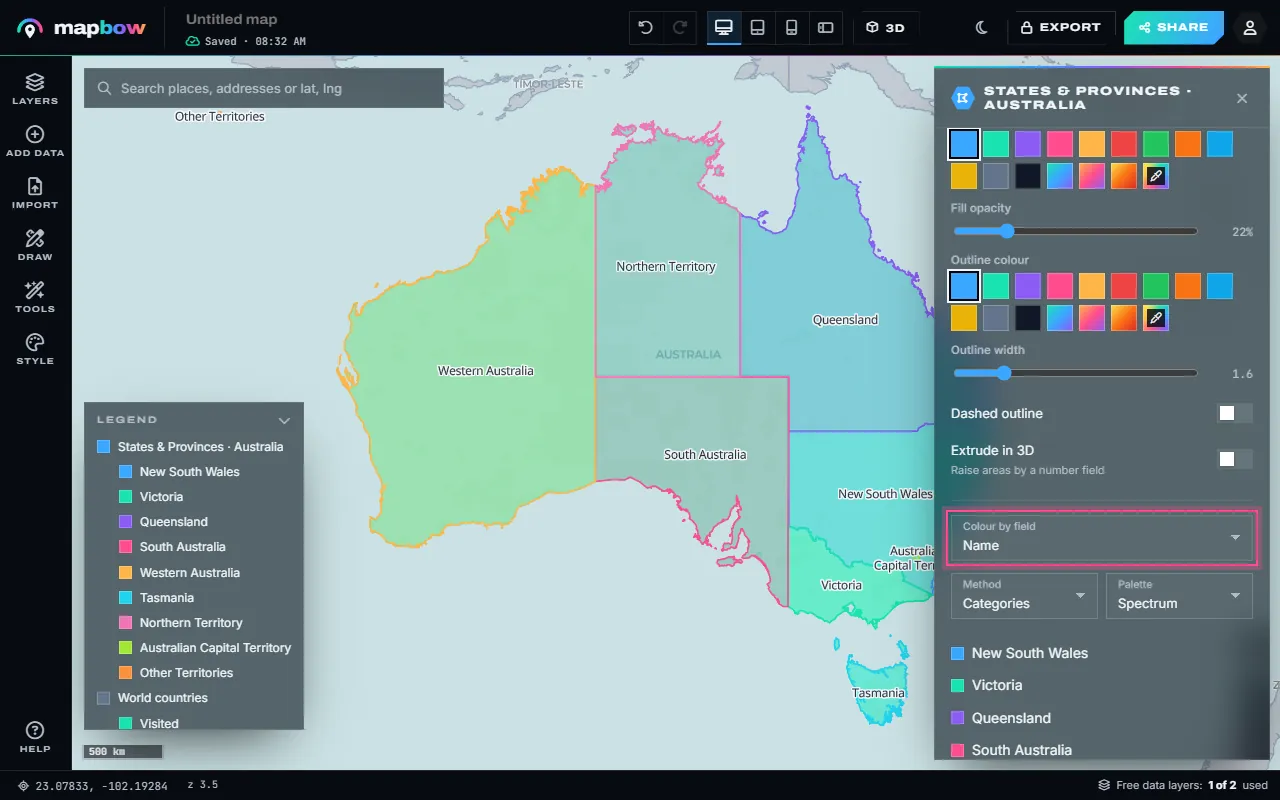
Step 3 Legend labels: Visited and Next on the list. - Or colour every region by a field. For states, provinces, districts or postcodes, add the layer from Add data and use Colour by field. Text fields get a colour each; number fields get graded classes (quantiles, equal steps, natural breaks or your own).
Step 4 Australian states, each in its own colour.
Finish by clicking the map title in the top bar to rename it, and choose a quiet basemap in Style – Positron, Light Gray or Blank light work well. The legend is on by default on the shared map; you can switch it, the title card and the layer switches on or off under Style › On the shared map.
Method 2: Shade by data (choropleth)
- Get data per region. The region layer needs a column to colour by. Import a GeoJSON, KML or zipped Shapefile that already holds your values, colour built-in boundaries by one of their existing fields, or create a count with Tools › Count in areas (see below).
- Open the layer style. Select the layer, and in its Style tab choose the column under Colour by field.
- Choose a method and classes. For numbers, pick Quantiles, Equal steps, Natural breaks or Manual, and 4–7 classes (the slider goes from 2 to 7). Quantiles (equal counts per class) suit skewed data; equal steps suit evenly spread data. Text columns use Categories.
- Pick a palette. Graded classes use sequential palettes – Blues, Greens, Sunset, Viridis or Magma – light for low, dark for high. Categories use Spectrum, Bold or Pastel.
- Check the legend. The classes are listed under the setting and in the map's legend. For round numbers, choose Manual and type your own breaks, such as
10, 50, 100.
Colour rules that work
| Data | Palette type | Do | Don't |
|---|---|---|---|
| Categories | Qualitative | Distinct hues, ≤7 categories | Use shades of one colour |
| Low → high | Sequential | Light = low, dark = high | Use a rainbow |
| Above/below a midpoint | Diverging | Neutral middle, two hues | Make the middle bright |
mapbow's graded palettes are sequential. For a diverging map – above and below a target, say – paint the regions by hand with two hues and a neutral grey for the middle, or use Manual breaks with a sequential palette and say in the legend where the midpoint is.
- Around 8% of men have some colour vision deficiency – avoid relying on red vs green alone.
- Give "no data" its own neutral grey so it isn't mistaken for zero.
- Thin, light borders keep small regions visible without clutter.
Ideas
- Countries visited / bucket list.
- Where you ship, sell or hold licences.
- Sales or market share by state.
- Survey or poll results by region.
- Teaching maps: languages, climate zones, time zones.
Sharing and exporting
Share a link, embed it, or – with any purchase – export a high-resolution PNG or PDF for slides and print, or the coloured regions as GeoJSON, Shapefile or a styled QGIS project.
Getting your own numbers onto regions
A choropleth needs one value per region. The most reliable way is to make sure your figures can be matched to region names:
- Start from the boundaries. Add the region layer you want (for example states & provinces) and look at the region names – click a few for their popups, or open the layer's Data tab and Open the table.
- Match your spreadsheet. Make sure your figures use exactly the same names, one row per region.
- Click-to-colour for small sets. For a dozen regions, pick one colour per value band ("0–10", "10–25", "25+"), paint each region into its band with Tools › Colour regions, then name the bands under Painted colours so they show in the legend.
- Import shapes with values for larger sets. If you have boundary files that already contain your values (GeoJSON, KML or a zipped Shapefile), or a spreadsheet with a WKT geometry column, import them and use Colour by field.
Counting points per region
Often the value you want is a count of places. Add a point layer – for example pharmacies – and a boundary layer, then open Tools › Count in areas: choose the boundaries as the areas and the pharmacies as the points. You get a new layer with a count for each region, already coloured by it and labelled. To make the comparison fair, divide by area or population before you shade, and say so in the legend ("pharmacies per 10,000 people").
Classification methods, simply
| Method | How it splits values | Good for |
|---|---|---|
| Equal steps (equal interval) | Same width ranges (0–20, 20–40…) | Evenly spread data, percentages |
| Quantiles | Same number of regions in each class | Skewed data, rankings |
| Natural breaks | Splits at gaps in the data | Clustered data |
| Manual | Breaks you type in | Meaningful thresholds (targets, legal limits) |
Whatever you choose, round the breaks to friendly numbers – a legend reading "1,000–5,000" is far easier to read than "1,037–4,982".
Labels and borders
Label only regions large enough to hold the text (Label each feature with in the Style tab, with a label size), or show the value in the popup instead. Keep borders thin and slightly darker than the fills; on dark basemaps use light borders. If small regions disappear at country scale, make a second, zoomed-in map of the dense area.
Frequently asked questions
How do I make a map with coloured countries?
In the studio choose Colour countries or regions, pick a colour and click countries to fill them. The World countries layer is free and added for you.
What is a choropleth map?
A map where areas are shaded according to a value, such as population density or sales per region.
Can I colour US counties?
Yes. Add the districts & counties layer for the United States and colour counties by clicking (Tools › Colour regions) or by data (Colour by field).
How do I add a legend?
The legend is built for you. For painted maps, give each colour a label under Painted colours; for Colour by field, the classes appear automatically.
How many colours should I use?
Five to seven classes or categories is the sweet spot for readability.
Can I print my coloured map?
Yes. Export to PDF or a high-resolution PNG with any data layer purchase.