How to Export a Map to Shapefile, QGIS or ArcGIS
Export map layers to Shapefile, GeoJSON, KML, CSV, Esri JSON or a ready-styled QGIS project, then open them in QGIS, ArcGIS Pro or ArcGIS Online.
Updated · by the mapbow team
Sometimes a web map is the start, not the end. You might need to run analysis in QGIS, hand a layer to a colleague using ArcGIS, load points into a database, or print a large-format map. mapbow exports everything on your map – your drawings, imports and data layers – in the formats professional tools expect. This guide explains each export and how to open it.
Who can export
Exports unlock with any purchase – a single $5 data layer or a $29 Country Pass. After that, every map you make can be exported in every format. If exports are still locked, the Export dialog shows the offers for the layers on your map. See pricing.
Step 1: Export from mapbow
- Open Export. Make your map in the studio (or open a saved one), then press Export in the top bar.
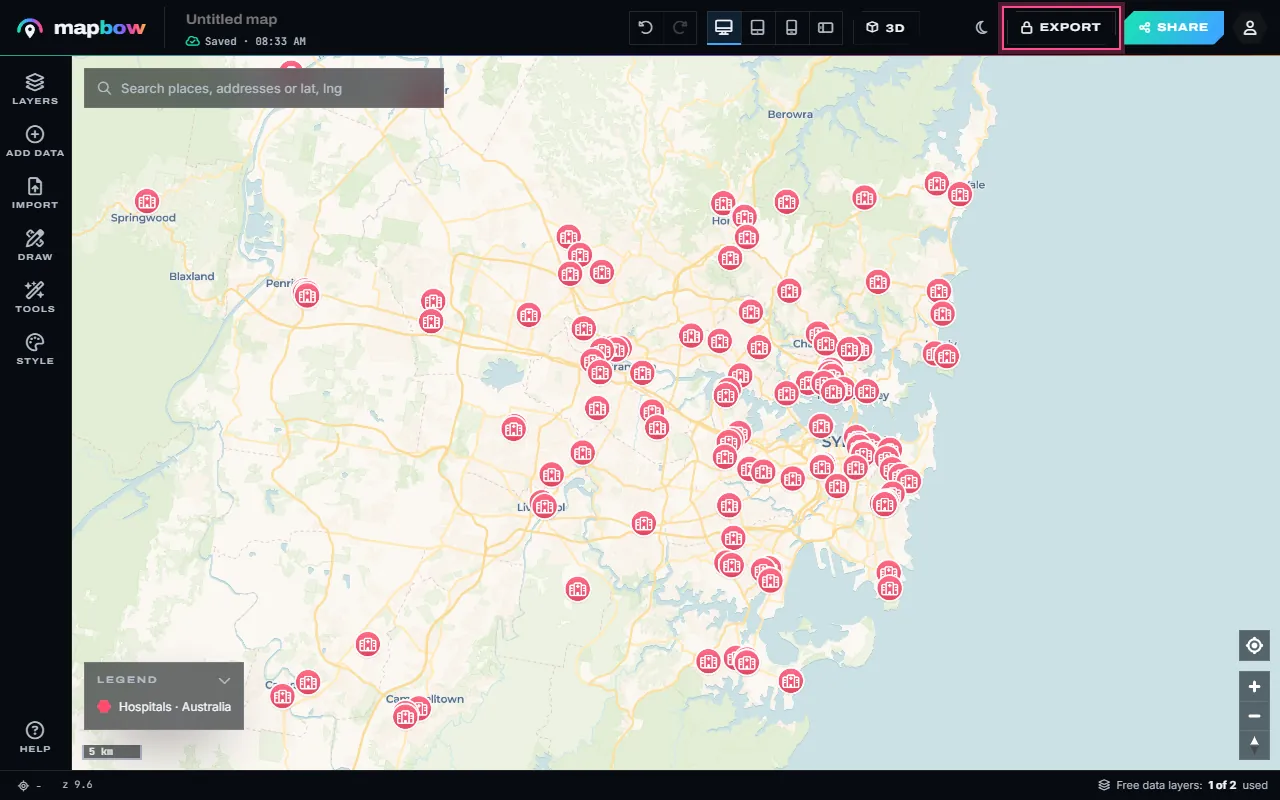
Step 1 The Export button. - Pick a format. Choose PNG, PDF, CSV, GeoJSON, KML/KMZ, GPX, Shapefile, ArcGIS (Esri JSON), a QGIS project or a standalone HTML map. Files are made in your browser from what is on the map, and the download starts straight away. Exports unlock with any purchase - one data layer or a Country Pass.
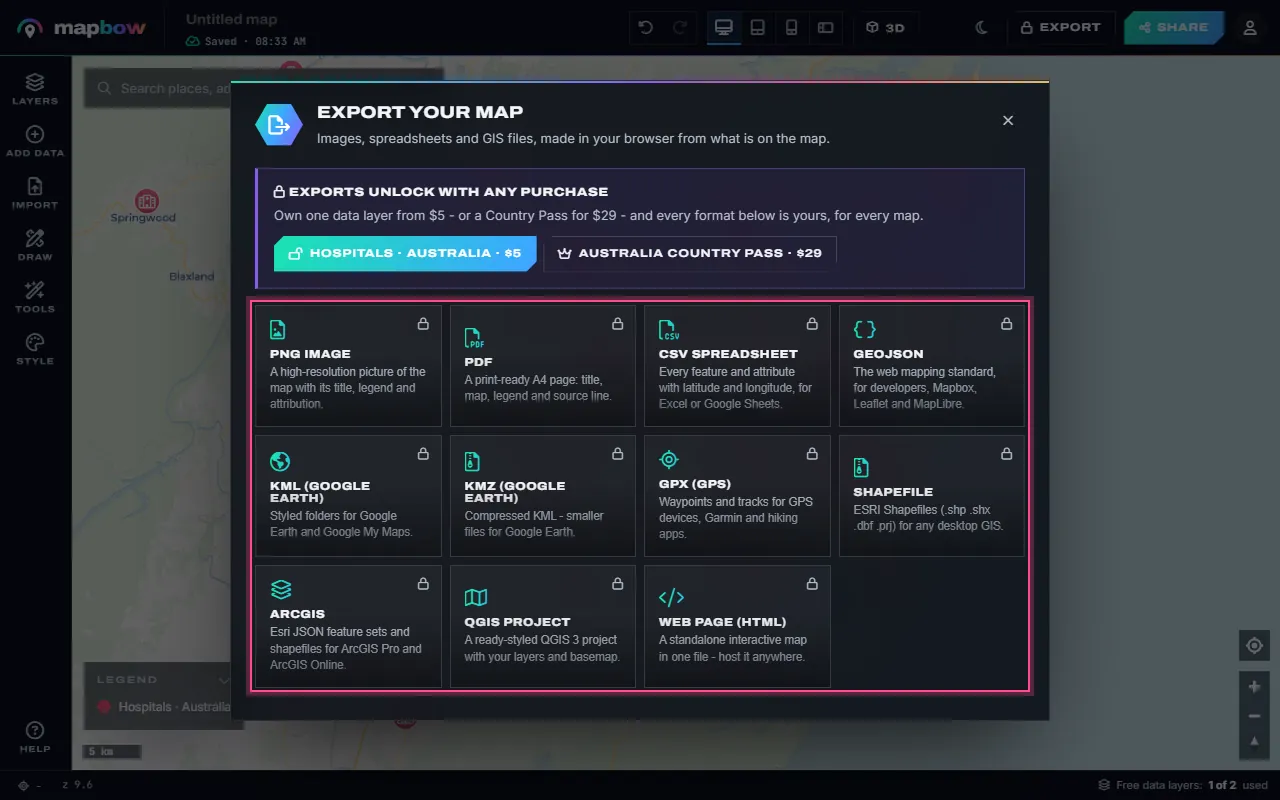
Step 2 Every export format in one place.
Every visible layer is exported; layers you have hidden with the eye button in the Layers panel are left out, so hide anything you don't want in the file first. Multi-file formats (Shapefile, ArcGIS, QGIS project) download as a single .zip with a README that lists what is inside.
| Format | What you get | Open with |
|---|---|---|
| Shapefile (.zip) | .shp, .shx, .dbf, .prj and .cpg per layer and geometry type | QGIS, ArcGIS Pro, ArcGIS Online, MapInfo, almost any GIS |
| QGIS project (.zip) | A .qgs project plus each layer as GeoJSON, with your colours and basemap | QGIS 3 |
| ArcGIS (.zip) | Esri JSON FeatureSets per layer and geometry type, plus the same data as shapefiles | ArcGIS Pro (JSON To Features), ArcGIS Online, ArcGIS APIs |
| GeoJSON | One standard GeoJSON file | QGIS, ArcGIS, web maps, code |
| KML / KMZ | Styled folders of placemarks | Google Earth, Google My Maps, ArcGIS, QGIS |
| GPX | Waypoints and tracks | GPS devices, fitness and hiking apps |
| CSV | A row per feature: latitude and longitude (plus WKT for shapes) and the attributes; one file per layer, zipped when there are several | Excel, Google Sheets, databases |
| PNG / PDF | The map as a high-resolution image or a print-ready A4 page with title and legend | Reports, slides, print |
| HTML | A standalone interactive map page in one file | Any browser, any web host |
Step 2a: Open in QGIS
Using the QGIS project (easiest)
- Unzip the download into a folder. Keep the files together.
- Double-click the .qgs file, or in QGIS choose Project → Open.
- Done. Your layers open with mapbow's colours, over an online basemap (it needs an internet connection).
Using a Shapefile or GeoJSON
Drag the .shp (or .geojson) file into the QGIS window, or use Layer → Add Layer → Add Vector Layer. QGIS reads the coordinate system from the .prj and the text encoding from the .cpg automatically.
Step 2b: Open in ArcGIS Pro
- Shapefile: unzip, then drag the .shp from the Catalog pane onto the map (or use Map → Add Data). To keep it, use Feature Class to Geodatabase.
- Esri JSON: export ArcGIS, unzip, and run the JSON To Features geoprocessing tool on each .json file in the
esri-jsonfolder to create a feature class. - GeoJSON: use JSON To Features with the GeoJSON option.
Step 2c: Upload to ArcGIS Online
In Content → New item, upload a zipped shapefile (zip one layer's .shp, .shx, .dbf, .prj and .cpg together), the GeoJSON or the CSV, and choose to create a hosted feature layer. Then add it to a Map Viewer map.
opening_hours becomes opening_ho). The Esri JSON in the ArcGIS export keeps each full name as the field alias. If you need the full names and long text, use GeoJSON or a QGIS project instead.Coordinate system
All exports use WGS 84 (EPSG:4326) longitude/latitude – the global standard for GPS and web maps. Your GIS can reproject to a local system (such as a UTM zone or a national grid) for measurement-heavy work.
Attribution
Built-in data layers come from OpenStreetMap (ODbL) and geoBoundaries (CC BY 4.0), whose licences require attribution when you publish or share the data. mapbow writes the attribution into the exports – on the PNG and PDF, inside the GeoJSON, KML and GPX files, and as an ATTRIBUTION.txt in every zip. A single CSV has nowhere to hold it, so add the credit yourself when you pass one on. Keep it with the data and show it on published maps. Details are on the data licence page.
A worked example: hospitals into QGIS
- Build the map. In the studio, add the hospitals layer and the states & provinces layer for your country from Add data, and colour them.
- Export the QGIS project. Press Export, choose QGIS project and the zip downloads.
- Open it. Unzip and double-click the .qgs file. Both layers appear with your colours over a basemap.
- Analyse. Use Vector → Analysis Tools → Count Points in Polygon to count hospitals per state, then join population figures to calculate hospitals per 100,000 people. (For the count alone you don't need QGIS: Tools › Count in areas in mapbow does it in the browser.)
- Lay out a print map. Use QGIS's Print Layout for a large-format PDF with a scale bar and north arrow.
Moving data into databases and BI tools
- PostgreSQL/PostGIS: load the GeoJSON or Shapefile with
ogr2ogror QGIS's DB Manager. - SQL Server, MySQL and others: the CSV export includes latitude/longitude columns, plus a WKT geometry column when a layer has lines or shapes.
- Excel and Power BI: use the CSV; Power BI's map visuals accept latitude and longitude columns directly.
- Google Earth: open the KML or KMZ.
- GPS and fitness apps: import the GPX file.
Exporting your own drawings vs. data layers
Everything on the map exports together – pins you dropped, shapes you drew, files you imported and built-in data layers. Each keeps its attributes: names, notes and any columns you added for your own features, and names, categories, addresses, contact details and regions for data layers. Colours and icons are written into formats that support styling (KML/KMZ, the QGIS project, the HTML map and the PNG/PDF images); data-only formats (Shapefile, GeoJSON, CSV, Esri JSON) carry the attributes but not the styling.
Large layers
Some layers contain hundreds of thousands of features – bus stops or car parks for a large country, for example. Exports of that size are best as GeoJSON or Shapefile rather than KML, and will open faster in QGIS than in a web viewer. If you only need one region, load just that region's part of the layer in Add data before exporting.
Frequently asked questions
How do I export a map to a shapefile?
Open the map, press Export in the top bar and choose Shapefile. The .zip downloads with everything a GIS needs.
Why are there several shapefiles?
A shapefile can only hold one geometry type, so mapbow writes separate files for points, lines and polygons in each layer. The README in the zip lists them.
Can I export only some layers?
Yes. Hide the layers you don't want with the eye button in the Layers panel – only visible layers are exported.
Can I keep my map's styling in QGIS?
Yes – export the QGIS project. It opens with your layer colours and a basemap.
Can ArcGIS read the export?
Yes. Use the ArcGIS export (Esri JSON plus shapefiles) or the Shapefile export for ArcGIS Pro, or upload a zipped shapefile, the GeoJSON or the CSV to ArcGIS Online.
Do I pay per export?
No. Any purchase unlocks unlimited exports of all your maps.