How to Make a Custom Map (Free, Step by Step)
Learn how to make a custom interactive map for free: pick a basemap, add places and boundaries, style layers, add labels and photos, then share or embed it.
Updated · by the mapbow team
A custom map is any map where you decide what is on it: your places, your boundaries, your colours, your labels. It might be a travel map for friends, a store locator for your website, a map of every hospital in a region for a report, or a colour-coded map of sales territories. A few years ago that meant desktop GIS software and a steep learning curve. Today you can do it in a browser in ten minutes.
This guide walks through the whole process in mapbow, from a blank page to a polished map you can share or embed. You don't need an account to start, and every step works free.
Before you start: decide what the map is for
The best maps answer one question. Write yours down before you open the editor – it decides almost every choice that follows.
- "Where are things?" – a pin map or heat map (stores, events, customers).
- "How do areas compare?" – a colour-coded region map (sales by state, visited countries).
- "What is near here?" – a radius or buffer map (delivery zones, catchments).
- "How do I get there?" – a route map (road trips, walking tours).
Also think about who will look at it and on what. Most shared maps are opened on a phone, which affects label sizes and how many layers you show at once.
Step by step: your first custom map
Here is the quickest route from nothing to a finished, shareable map: ready-made places for a country, styled your way, with a few pins of your own on top.
- Open the studio. Go to mapbow.com/studio. There is nothing to install and no sign-up to start - the start screen offers the most common kinds of map: Places in a country, Draw on a map, Radius & distance, Colour countries or regions, Import your own data or Start with a blank map.
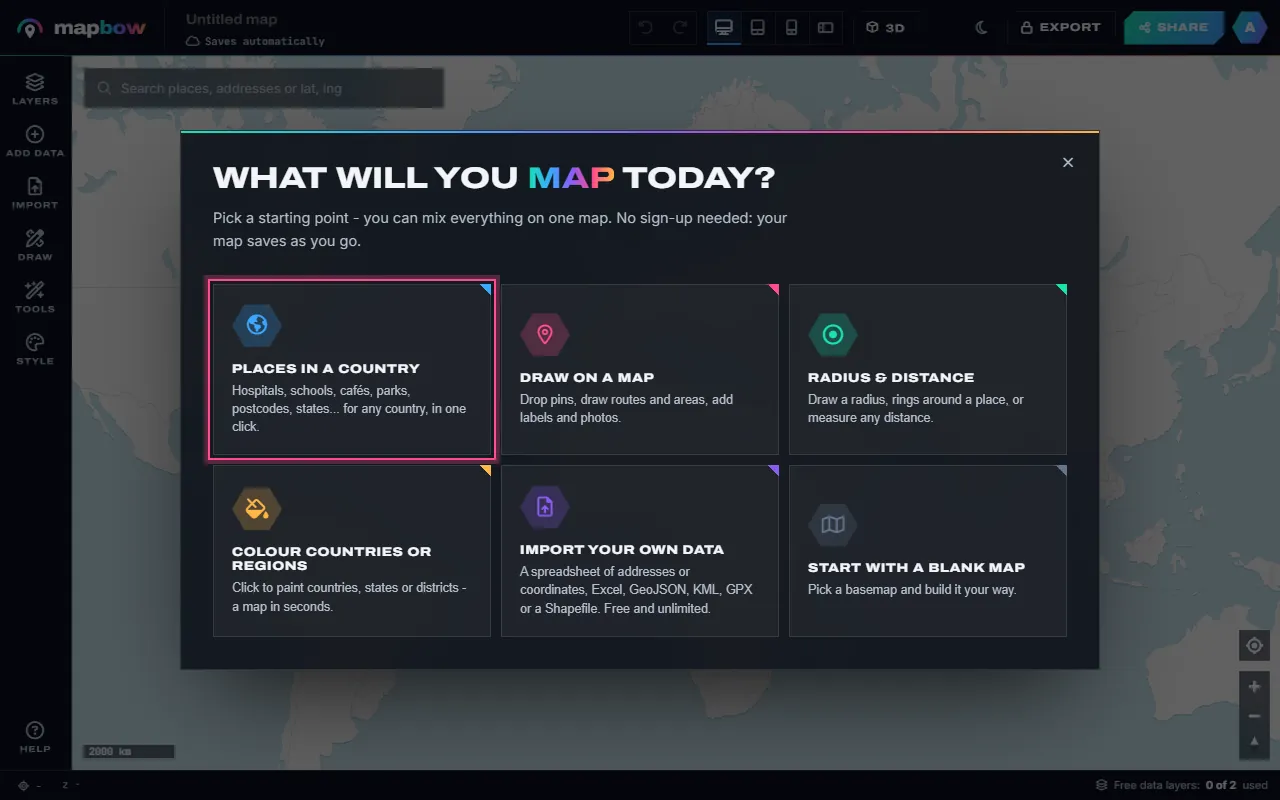
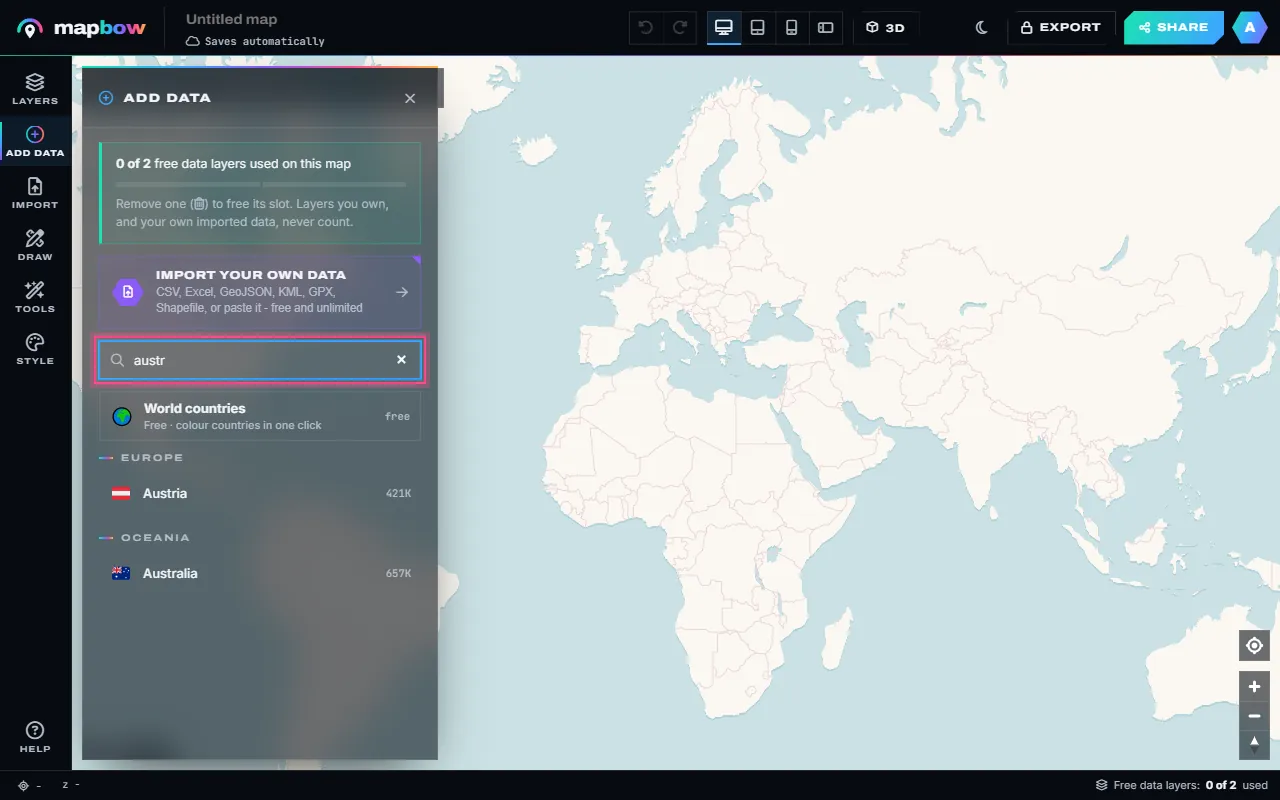
Step 1 The start screen. Pick Places in a country to begin with ready-made data. - Pick a country. The Add data panel lists 199 countries and territories. Type a few letters to find yours.
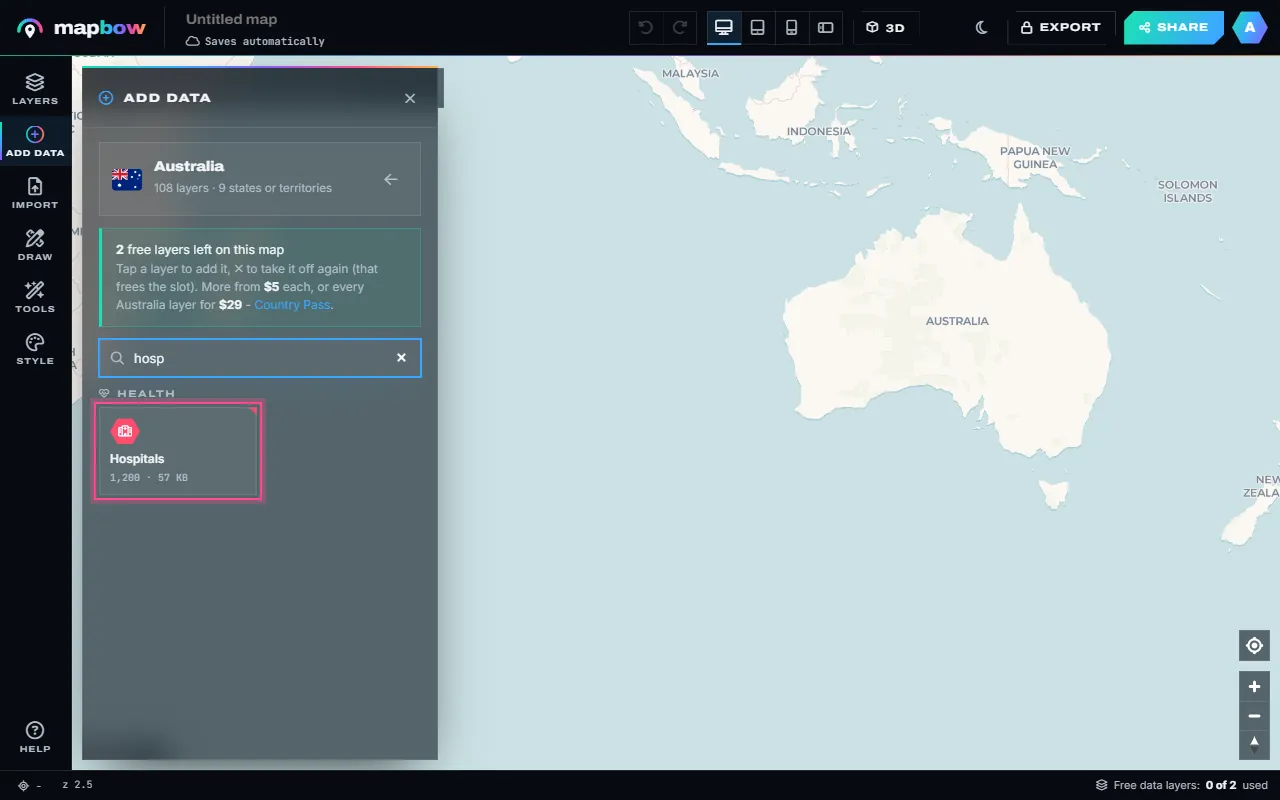
Step 2 Find a country by typing its name. - Choose a layer. Every layer type the country has is listed - hospitals, schools, cafés, parks, postcodes, states and 100 more - with how many places each holds. Two layers per map are free.
Step 3 Search the layers, then click one to put it on the map. - See it on the map. The layer appears straight away. Its tile now says On map; the small takes it off again and frees the slot for another layer.
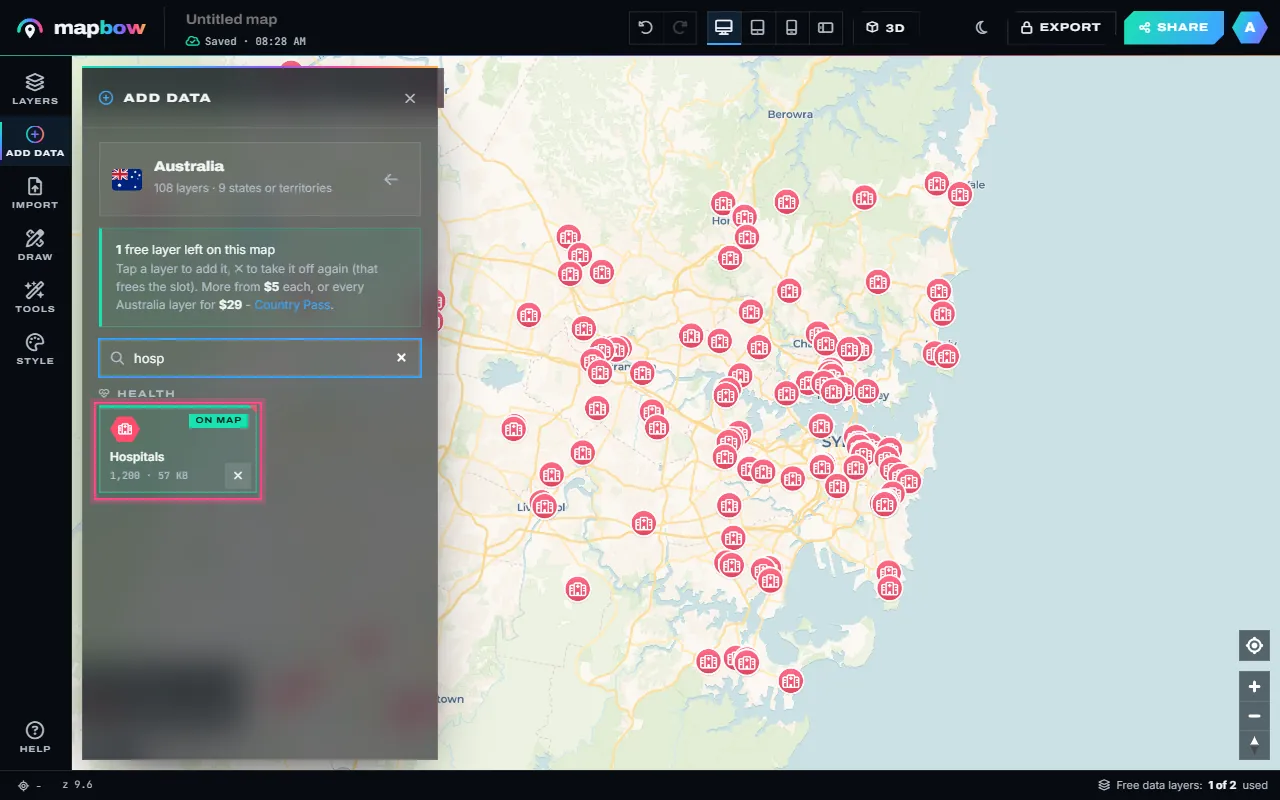
Step 4 Hospitals in Sydney, added in one click. The ✕ removes the layer again. - Style it. Click a layer to open its inspector. Pick a colour, pins, badges, dots or a heat map, an icon or emoji, the size, and labels. Every change shows on the map as you make it.
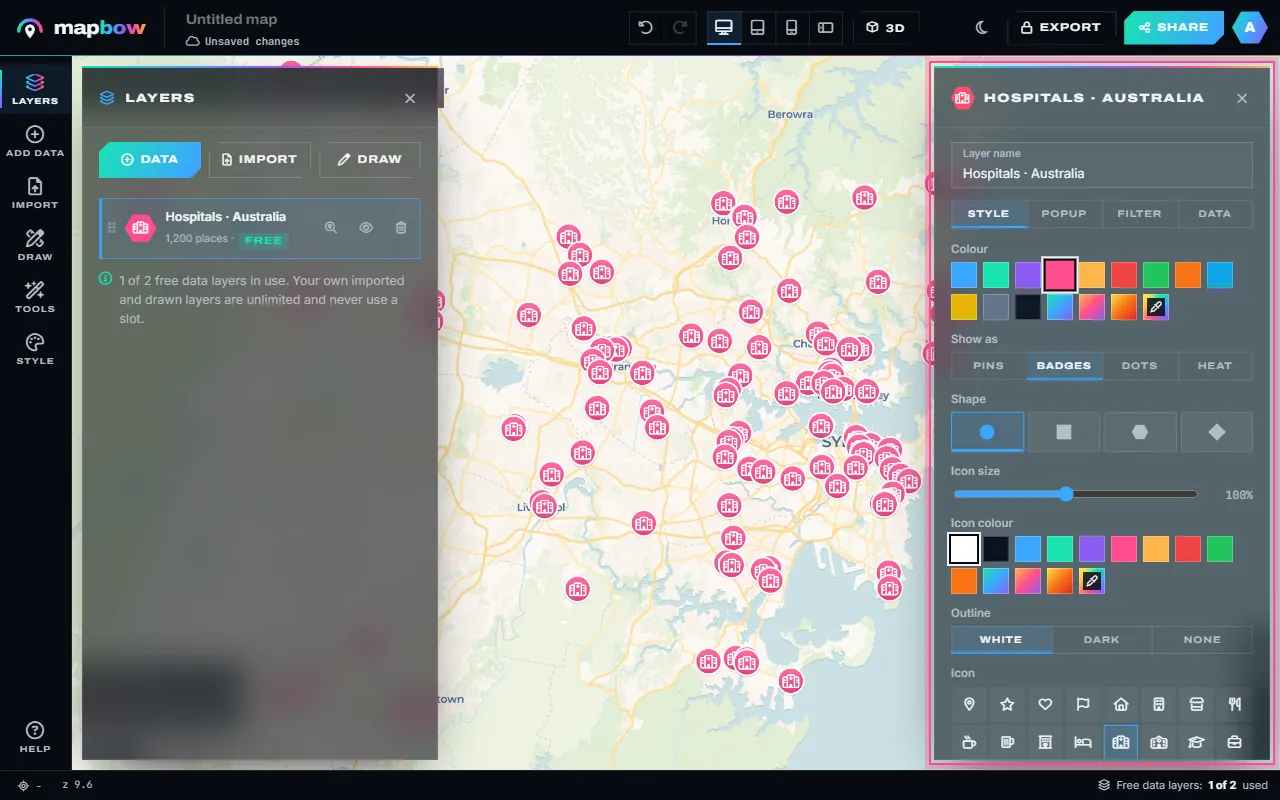
Step 5 The inspector: colour, marker style, icon and size. - Add your own pins. Open Draw and choose Pin (or press P), then click the map. Give the pin a name, notes, a colour, an icon or a photo. Lines, areas, circles, text and freehand work the same way.
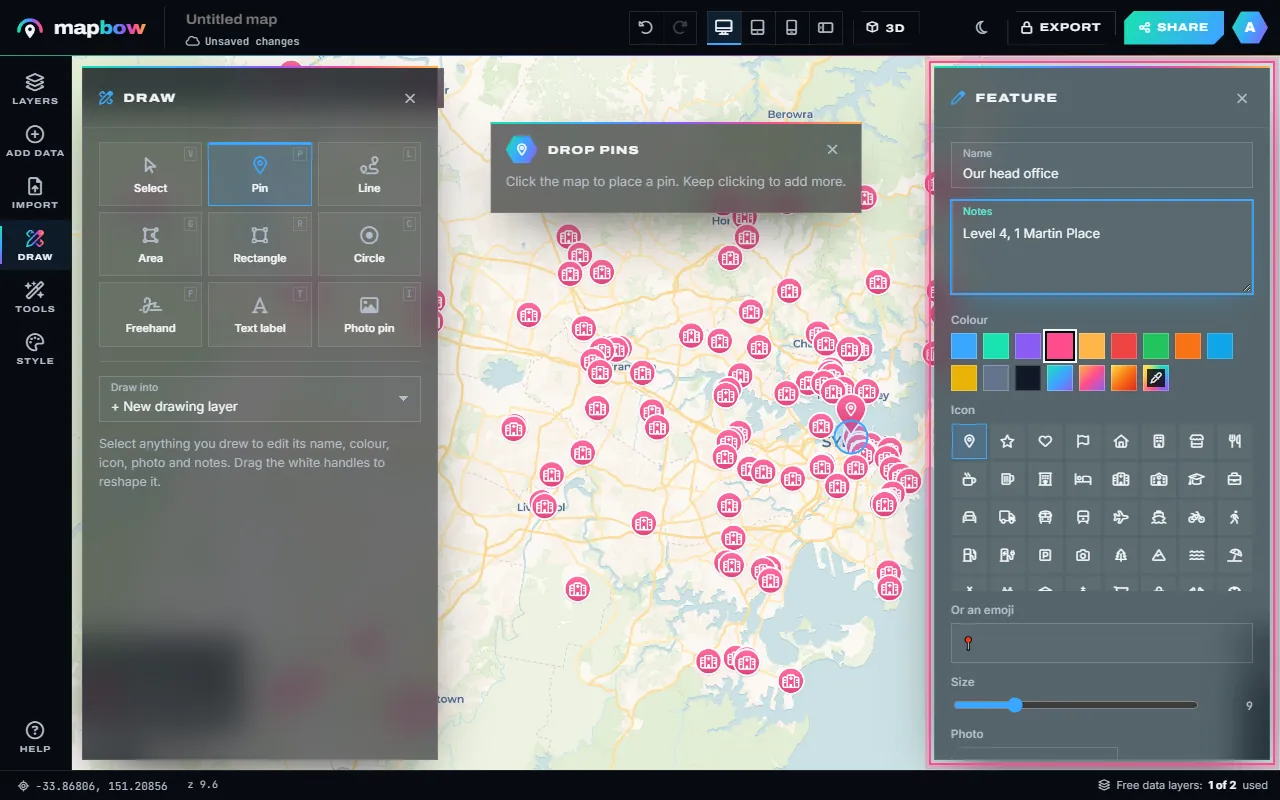
Step 6 A pin of your own, with a name and notes shown in its popup. - Share or embed it. Your map saves as you go. Click the title in the top bar to name it, then press Share to switch on the link, copy it, post it, or copy the embed code for your website. Sharing needs a free account.
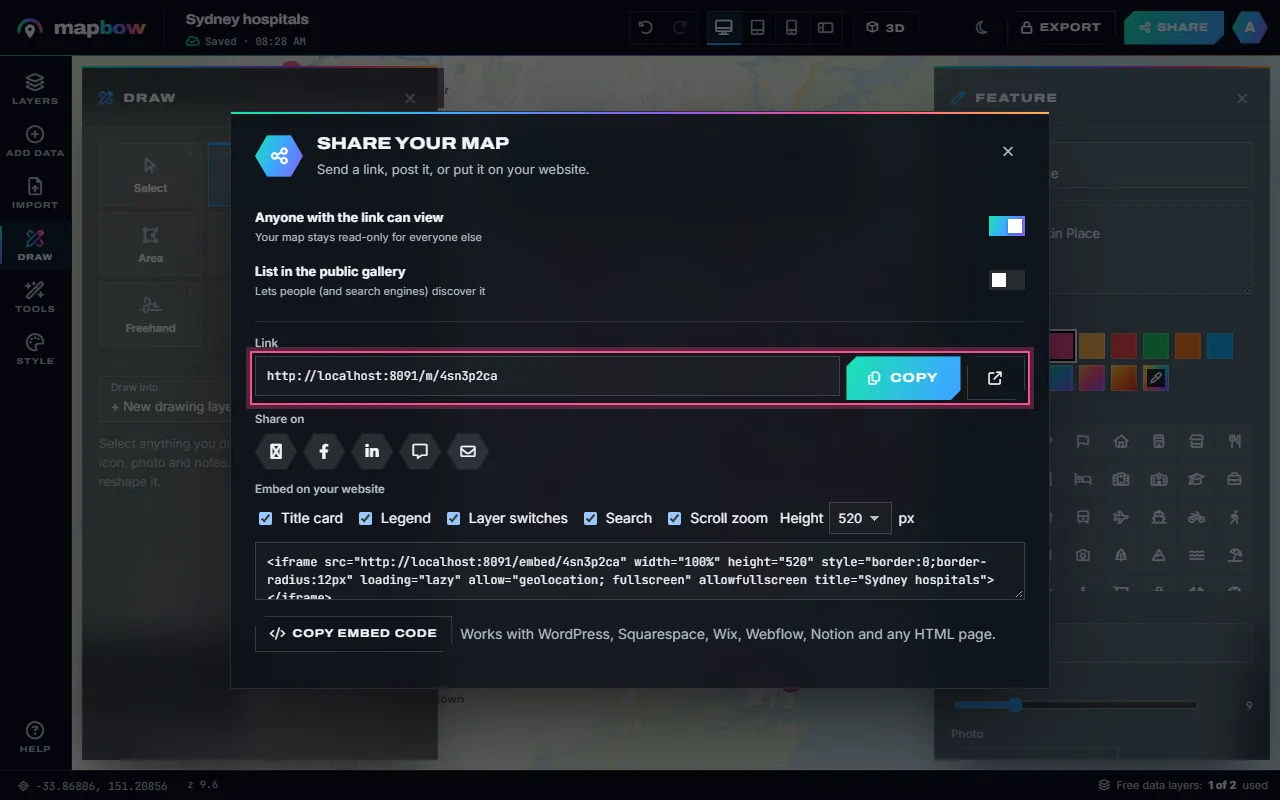
Step 7 Share: a link anyone can open, social buttons and embed code.
That is a complete map. The sections below go deeper into each part – the basemap, the three ways to add content, styling, popups, analysis and publishing.
Choose a basemap
The basemap is the background: roads, terrain, water and place names. Open Style on the left rail to pick one of 16. Choose one that supports your data rather than competing with it.
| Basemap | Looks like | Best for |
|---|---|---|
| Positron, Light Gray | Pale grey, minimal | Data-heavy maps, colour-coded regions, reports |
| Dark Matter | Near black, subtle labels | Heat maps, glowing points, dramatic presentations |
| Voyager, OpenStreetMap, Esri Streets | Classic street map | City guides, directions, store locators |
| Satellite, Satellite + labels | Aerial photos | Property, farming, outdoor and site maps |
| Topographic, OpenTopoMap | Contours and relief | Hiking, terrain, environmental maps |
| Blank light, Blank dark | Plain background, no streets | Region maps and posters where only your data matters |
You can change the basemap at any time without losing anything, so don't overthink it. Press 3D in the top bar to tilt the map and turn on terrain and buildings together – a striking effect for presentations and mountain areas (see how to make a 3D map). Under Style › 3D & globe you can also switch on Globe view to show the whole earth as a sphere, and choose the colour of the space around it.
Three ways to add content
There are three ways to put things on the map, and you can mix them freely in one map.
Draw it yourself
Open Draw and pick a tool: Pin (P), Line (L), Area (G), Rectangle (R), Circle (C), Freehand (F), Text label (T) or Photo pin. For lines and areas, click each corner, then double-click or press Enter to finish; Backspace removes the last point and Esc cancels. Select a shape to give it a name, notes, a colour, an icon or emoji, and a photo (upload one or paste a link). Drag its white handles to reshape it; a circle has a Radius field instead. Length, area and perimeter are measured for you. This is perfect for a handful of hand-picked places or a custom zone.
Import your own data
Open Import and drop in a CSV, TSV, Excel (.xlsx), GeoJSON, KML, KMZ, GPX or zipped Shapefile – or paste rows copied from a spreadsheet into Paste data. Columns named lat/lng, latitude/longitude or x/y are found automatically, and every other column becomes popup information. No coordinates? Put one address per line in the Addresses box and mapbow looks them up (up to 250). Imports are free, unlimited and never use a data-layer slot. The Excel and CSV import guide covers this in detail.
Add ready-made data layers
This is where mapbow saves you hours. Open Add data, pick a country and choose from 109 layer types – hospitals, schools, restaurants, fuel stations, national parks, states, postcode areas and more. Big layers can be loaded for the whole country or for one region. Each map can use two data layers free; the meter at the top of the panel shows how many you have left, and the ✕ on a tile frees its slot again. Extra layers are $5 each, once, and yours to reuse in every map. Browse what is available on map data by country.
Style your layers
Click any layer in the Layers panel to open its inspector on the right. The Style tab holds everything about how it looks. A few decisions make the difference between a cluttered map and a clear one:
- Colour. One strong colour per layer. Use contrasting colours for things you want to compare and similar colours for related things.
- Show as. Pins, Badges or Dots for individual places, or Heat to show density instead (heat map maker).
- Icon and size. Pick from the icon grid or use an emoji. Icons help people recognise categories instantly; keep markers small when there are many.
- Colour by field. Give each category in a column (type, brand, region) its own colour, or shade numbers from light to dark using quantiles, equal steps, natural breaks or your own breaks. A legend is made for you.
- Cluster nearby points. Groups nearby points into numbered bubbles when zoomed out – essential above a few hundred points.
- Opacity and outlines. For areas, around 30–50% fill opacity with a solid outline keeps the basemap readable underneath. Lines can be thicker or dashed.
- Extrude in 3D. Raise areas by a number field, such as population or sales, for a 3D bar-chart effect.
Drag layers up and down in the Layers panel to change which sits on top, and use the eye to hide one for a moment.
Add labels, popups and images
Labels are text drawn on the map; popups appear when someone clicks or taps a feature. Use labels sparingly – for the few things everyone should see – and put detail in popups.
- Labels. In Style, set Label each feature with to a field (usually the name) and choose the label size. For free-standing titles and notes, use the Text label draw tool.
- Popups. The Popup tab chooses a design – Card, Banner, Photo, Compact, Table or Minimal – the popup title and which fields show. Choose Your own to design a popup with your own text, accent colour, photo and Directions, Website and Call buttons, then save it to My designs to reuse on other maps (how to customise map popups).
- Photos. Add a photo to any pin or shape you drew, or drop a Photo pin. For imported data, a column of image links can fill the popup's photo.
Explore and analyse (optional)
Your map can answer questions, not just show things. The Tools panel includes:
- Measure – Distance (M), Area (A), Radius & rings, Coordinates (K) and Nearest, which finds the closest place in a layer to wherever you click. See the distance and area calculators.
- Explore your data – the Attribute table (every feature as a searchable, sortable row), Statistics (counts, totals, averages and most common values), Filter (show only what matches a rule, such as "type is Flagship") and Clip to area. See how to filter and analyse map data.
- Count in areas – count the places inside each area, such as pharmacies per postcode, and colour the areas by the count.
- Hex bins – group thousands of points into equal hexagons coloured by how many each holds (hexbin map guide).
- Buffer, convex hull, bounding box, centroids, Voronoi, merge areas and simplify – handy geometry tools for more advanced maps.
Tools work on what a layer's filter shows, run in your browser, and put their results on the map as new layers you can style like any other.
Preview on every screen
Use the device preview buttons in the top bar to see the map as a desktop, tablet, phone or phone-landscape viewer would. Check that labels are readable, the legend doesn't cover anything important and the starting view frames your content. Then frame the map as you want viewers to see it first and choose Tools › Set start view (or Use the current view as the start view in Style). Tools › Fit to data zooms to everything on the map first if you need it.
Share, embed or export
- Give it a title and description. Click the title in the top bar to rename the map, and add a description under Style › About this map. Both show on the shared map and in link previews.
- Choose what viewers see. In Style, under On the shared map, switch the title card, legend, layer switches, search box and find-my-location button on or off.
- Share a link. Press Share and switch on Anyone with the link can view. Viewers can explore and click, but only you can edit. Copy the link or post it to X, Facebook, LinkedIn, WhatsApp or email.
- Embed it. Copy the embed code under Embed on your website into your website, blog or CMS (embedding guide).
- List it in the gallery (optional) so others can discover it.
- Export files. With any purchase you can use Export for PNG and PDF images, plus CSV, GeoJSON, KML, KMZ, GPX, Shapefile, Esri JSON, a ready-styled QGIS project and a stand-alone web page (export guide).
Common mistakes to avoid
- Too many layers at once. If a map needs a paragraph to explain, split it into two maps or let viewers toggle layers.
- Rainbow colours for numbers. Use one colour from light to dark for low-to-high values.
- Labels everywhere. Label the important few; use popups for the rest.
- Forgetting mobile. Always check the phone preview before sharing.
- No legend. If colours mean something, turn the legend on.
Frequently asked questions
Can I make a custom map for free?
Yes. Creating unlimited maps, drawing, importing your own data, styling, measuring, 3D, sharing and embedding are all free in mapbow. Each map can also use two built-in data layers free. Sharing needs a free account.
Do I need any GIS experience?
No. The studio is designed for people who have never used mapping software: search for a place, click to add things, and pick colours from a panel.
Can I put my custom map on my website?
Yes. Every shared map has an embed code that works in WordPress, Squarespace, Wix, Webflow, Shopify, Notion and plain HTML.
Can I add my own photos?
Yes. Attach a photo to any pin or shape you draw – upload it or paste a link – and it appears in its popup. A Photo pin puts the picture on the map itself.
Where does the built-in map data come from?
Places come from OpenStreetMap and boundaries from geoBoundaries, compiled into ready-to-use layers and refreshed regularly. Full credits are on the data licence & attributions page.
Can I edit a map after sharing it?
Yes. Changes appear on the shared link and every embed straight away – there is nothing to re-publish.